> ## Documentation Index
> Fetch the complete documentation index at: https://docs.nikaplanet.com/llms.txt
> Use this file to discover all available pages before exploring further.
# Vector Layer Styling
> Customize the appearance of vector layers with polygon fill, line, point icon, text label, and legend options
Customize how your vector layers appear on the map using the Layer Styles panel. Control fill colors, line widths, point icons, text labels, and more to make your data stand out.
## How to Style Vector Layers
### Access Styling Panel
1. **Click on a vector layer** in the layers panel to select it
2. The **styling panel opens** on the side with all vector customization options
3. Use the **header buttons** to zoom to the layer, access layer settings (rename, remove, export, etc.), or unselect the layer
The panel automatically detects your layer's geometry types (points, lines, polygons) and shows only the relevant styling sections.
 ### Available Styling Sections
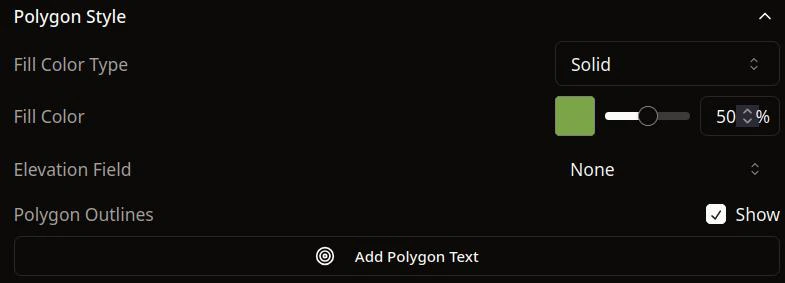
#### **Polygon Style** (polygon layers)
* **Fill Color Type**: Choose between Solid, Gradient, or Unique Values
* **Fill Color**: Pick a color and adjust opacity (0–100%) when using Solid mode
* **Gradient**: Color polygons based on a numeric property using a color ramp with continuous or discrete interpolation
* **Unique Values**: Assign distinct colors to each unique value of a chosen property, with preset ramp or custom colors
* **Elevation Field**: Extrude polygons in 3D based on a numeric property
* **Polygon Outlines**: Toggle stroke visibility on or off
* **Add Polygon Text**: Generate text labels at polygon centroids by selecting a property (creates a new point layer)
### Available Styling Sections
#### **Polygon Style** (polygon layers)
* **Fill Color Type**: Choose between Solid, Gradient, or Unique Values
* **Fill Color**: Pick a color and adjust opacity (0–100%) when using Solid mode
* **Gradient**: Color polygons based on a numeric property using a color ramp with continuous or discrete interpolation
* **Unique Values**: Assign distinct colors to each unique value of a chosen property, with preset ramp or custom colors
* **Elevation Field**: Extrude polygons in 3D based on a numeric property
* **Polygon Outlines**: Toggle stroke visibility on or off
* **Add Polygon Text**: Generate text labels at polygon centroids by selecting a property (creates a new point layer)
 #### **Line Style** (line layers and polygon outlines)
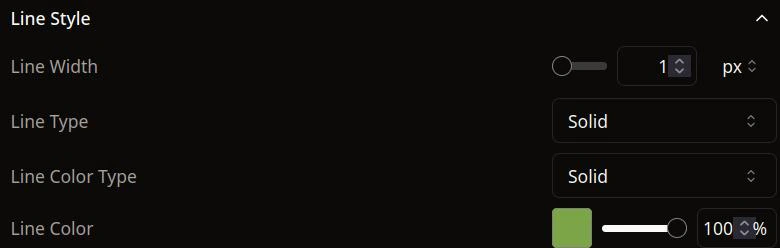
* **Line Width**: Set thickness using a slider or numeric input, with unit selection (pixels, meters, km)
* **Line Type**: Choose between Solid or Dashed
* **Dash Parameters**: When dashed, configure dash length and gap (as multiples of line width)
* **Line Color Type**: Choose between Solid, Gradient, or Unique Values
* **Line Color**: Pick a color and adjust opacity (0–100%) when using Solid mode
* **Gradient**: Color lines based on a numeric property using a color ramp with continuous or discrete interpolation
* **Unique Values**: Assign distinct colors to each unique value of a chosen property
#### **Line Style** (line layers and polygon outlines)
* **Line Width**: Set thickness using a slider or numeric input, with unit selection (pixels, meters, km)
* **Line Type**: Choose between Solid or Dashed
* **Dash Parameters**: When dashed, configure dash length and gap (as multiples of line width)
* **Line Color Type**: Choose between Solid, Gradient, or Unique Values
* **Line Color**: Pick a color and adjust opacity (0–100%) when using Solid mode
* **Gradient**: Color lines based on a numeric property using a color ramp with continuous or discrete interpolation
* **Unique Values**: Assign distinct colors to each unique value of a chosen property
 #### **Point Style** (point layers)
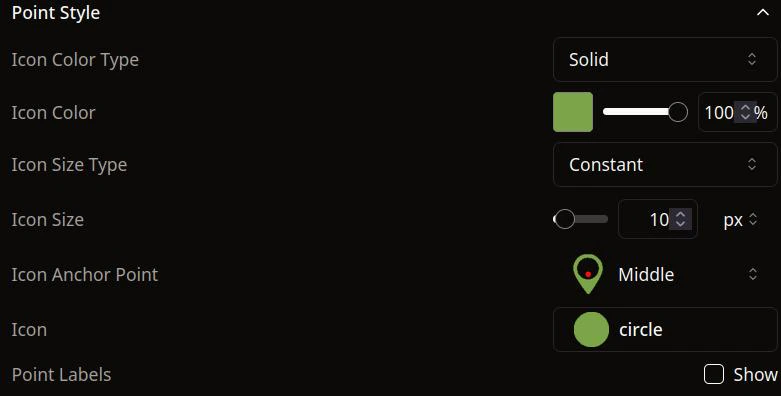
* **Icon Color Type**: Choose between Base SVG, Solid, Gradient, or Unique Values
* **Icon Color**: Pick a color and adjust opacity (0–100%) when using Solid mode
* **Gradient**: Color points based on a numeric property using a color ramp
* **Unique Values**: Assign distinct colors to each unique value of a chosen property
* **Icon Size Type**: Choose between Constant, Proportional, or Ranges
* **Icon Size**: Set a fixed size with unit selection (pixels, meters, km) when using Constant mode
* **Proportional Size**: Scale icon size between a min and max based on a numeric property, with linear or logarithmic normalization
* **Range Size**: Define custom size ranges based on a numeric property
* **Icon Anchor Point**: Set where the icon anchors to the point — Top, Middle, or Bottom
* **Icon**: Choose from default icon groups or upload custom SVG icons (searchable library with grouped categories)
* **Point Labels**: Toggle text labels on points
#### **Point Style** (point layers)
* **Icon Color Type**: Choose between Base SVG, Solid, Gradient, or Unique Values
* **Icon Color**: Pick a color and adjust opacity (0–100%) when using Solid mode
* **Gradient**: Color points based on a numeric property using a color ramp
* **Unique Values**: Assign distinct colors to each unique value of a chosen property
* **Icon Size Type**: Choose between Constant, Proportional, or Ranges
* **Icon Size**: Set a fixed size with unit selection (pixels, meters, km) when using Constant mode
* **Proportional Size**: Scale icon size between a min and max based on a numeric property, with linear or logarithmic normalization
* **Range Size**: Define custom size ranges based on a numeric property
* **Icon Anchor Point**: Set where the icon anchors to the point — Top, Middle, or Bottom
* **Icon**: Choose from default icon groups or upload custom SVG icons (searchable library with grouped categories)
* **Point Labels**: Toggle text labels on points
 #### **Text Style** (point layers with labels enabled)
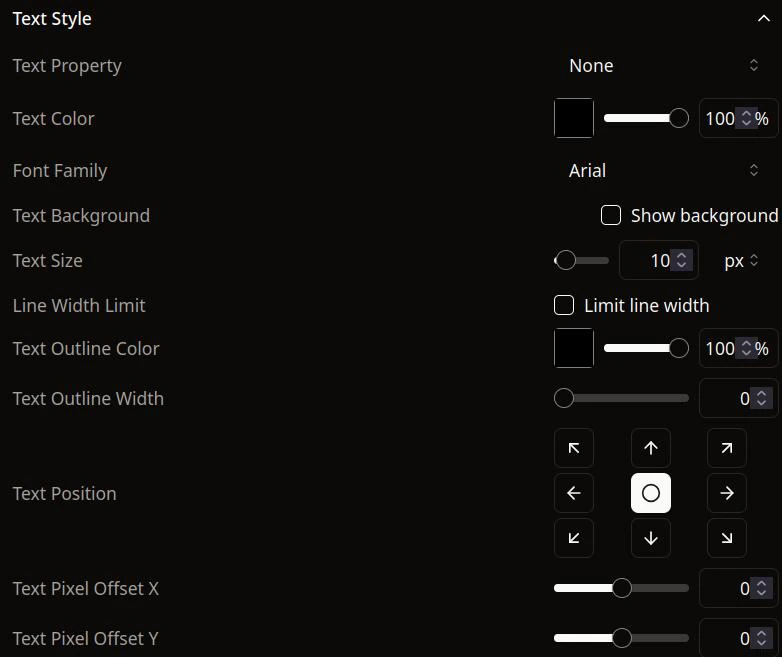
* **Text Property**: Select which feature property to display as text
* **Text Color**: Pick a color and adjust opacity (0–100%)
* **Font Family**: Choose from Arial, Courier New, Helvetica, Inter, JetBrains Mono, Libre Baskerville, Merriweather, Noto Sans, Roboto, or Times New Roman
* **Text Background**: Toggle a background rectangle behind text labels
* **Background Color**: Pick a color and adjust opacity when background is enabled
* **Background Corner Radius**: Adjust border radius of the background rectangle (0–50)
* **Text Size**: Set size with unit selection (pixels, meters, km)
* **Line Width Limit**: Optionally limit how wide a text line can be before wrapping (1–50 characters)
* **Text Outline Color**: Pick a halo/outline color and adjust opacity
* **Text Outline Width**: Set the outline thickness (0–10)
* **Text Position**: Choose anchor and alignment using a 3×3 directional grid
* **Text Pixel Offset X/Y**: Fine-tune text position with pixel offsets
#### **Text Style** (point layers with labels enabled)
* **Text Property**: Select which feature property to display as text
* **Text Color**: Pick a color and adjust opacity (0–100%)
* **Font Family**: Choose from Arial, Courier New, Helvetica, Inter, JetBrains Mono, Libre Baskerville, Merriweather, Noto Sans, Roboto, or Times New Roman
* **Text Background**: Toggle a background rectangle behind text labels
* **Background Color**: Pick a color and adjust opacity when background is enabled
* **Background Corner Radius**: Adjust border radius of the background rectangle (0–50)
* **Text Size**: Set size with unit selection (pixels, meters, km)
* **Line Width Limit**: Optionally limit how wide a text line can be before wrapping (1–50 characters)
* **Text Outline Color**: Pick a halo/outline color and adjust opacity
* **Text Outline Width**: Set the outline thickness (0–10)
* **Text Position**: Choose anchor and alignment using a 3×3 directional grid
* **Text Pixel Offset X/Y**: Fine-tune text position with pixel offsets
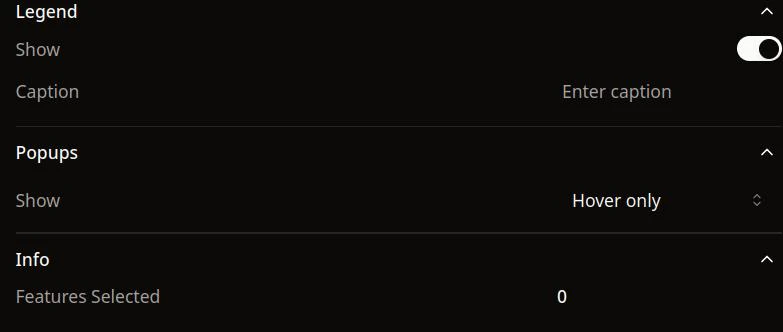
 #### **Legend Section**
* **Show**: Toggle whether the layer appears in the legend
* **Caption**: Add descriptive text for the layer legend
#### **Popups Section**
* **Show**: Configure when popup information appears (Hover Only)
#### **Info Section**
* **Features Selected**: View how many features are currently selected, with an option to unselect all
#### **Legend Section**
* **Show**: Toggle whether the layer appears in the legend
* **Caption**: Add descriptive text for the layer legend
#### **Popups Section**
* **Show**: Configure when popup information appears (Hover Only)
#### **Info Section**
* **Features Selected**: View how many features are currently selected, with an option to unselect all
 ## Color Modes
These color modes apply to both **Polygon Style** and **Line Style** sections. The same three modes are also available for **Point Style** icon coloring (with an additional Base SVG option for points).
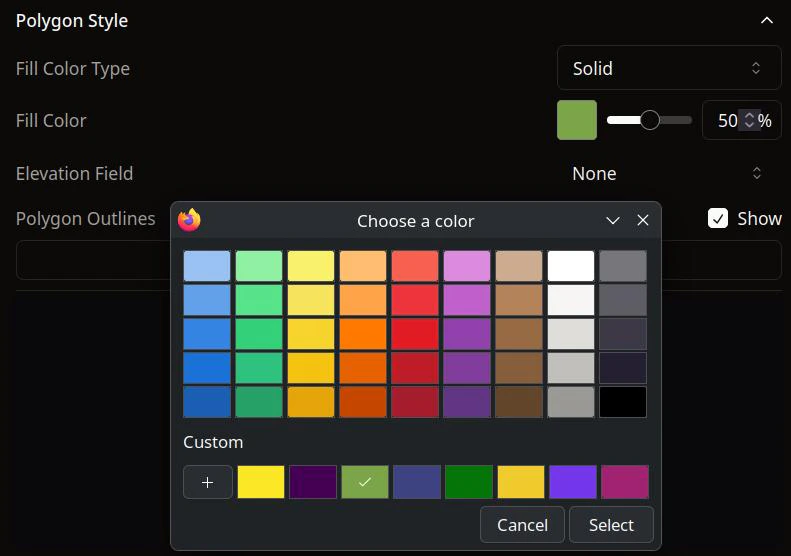
### Solid
* **Pick a single color** from the color picker
* **Adjust opacity** with the slider (0–100%)
* All features in the layer share the same color
## Color Modes
These color modes apply to both **Polygon Style** and **Line Style** sections. The same three modes are also available for **Point Style** icon coloring (with an additional Base SVG option for points).
### Solid
* **Pick a single color** from the color picker
* **Adjust opacity** with the slider (0–100%)
* All features in the layer share the same color
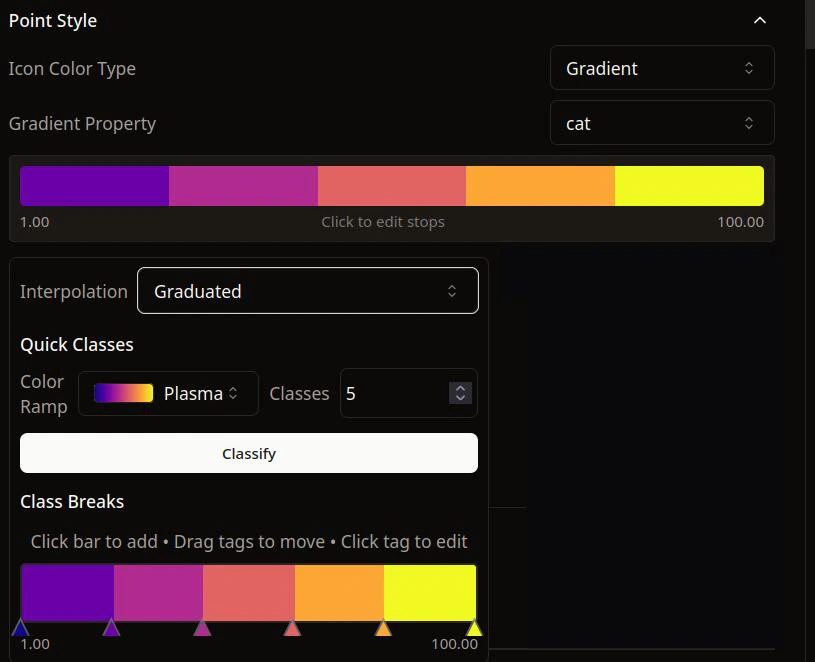
 ### Gradient
Color features based on a numeric property value.
1. **Select a numeric property** from the dropdown
2. **Choose a preset color ramp** or customize individual stops
3. **Set interpolation method** — Continuous for smooth gradients or Discrete for classified breaks
4. **Configure number of classes** and apply to generate evenly spaced class breaks
### Gradient
Color features based on a numeric property value.
1. **Select a numeric property** from the dropdown
2. **Choose a preset color ramp** or customize individual stops
3. **Set interpolation method** — Continuous for smooth gradients or Discrete for classified breaks
4. **Configure number of classes** and apply to generate evenly spaced class breaks
 ### Unique Values
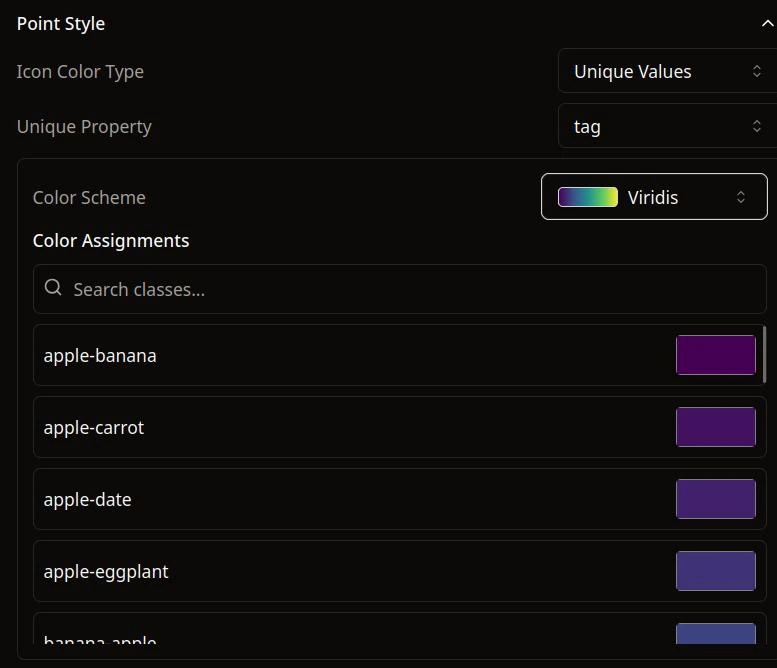
Assign a distinct color to each unique value of a chosen property.
1. **Select any property** from the dropdown
2. **Choose a preset color ramp** (including random) or customize individual colors
3. **Edit individual colors** by clicking any color swatch
### Unique Values
Assign a distinct color to each unique value of a chosen property.
1. **Select any property** from the dropdown
2. **Choose a preset color ramp** (including random) or customize individual colors
3. **Edit individual colors** by clicking any color swatch
 ## Icon Library
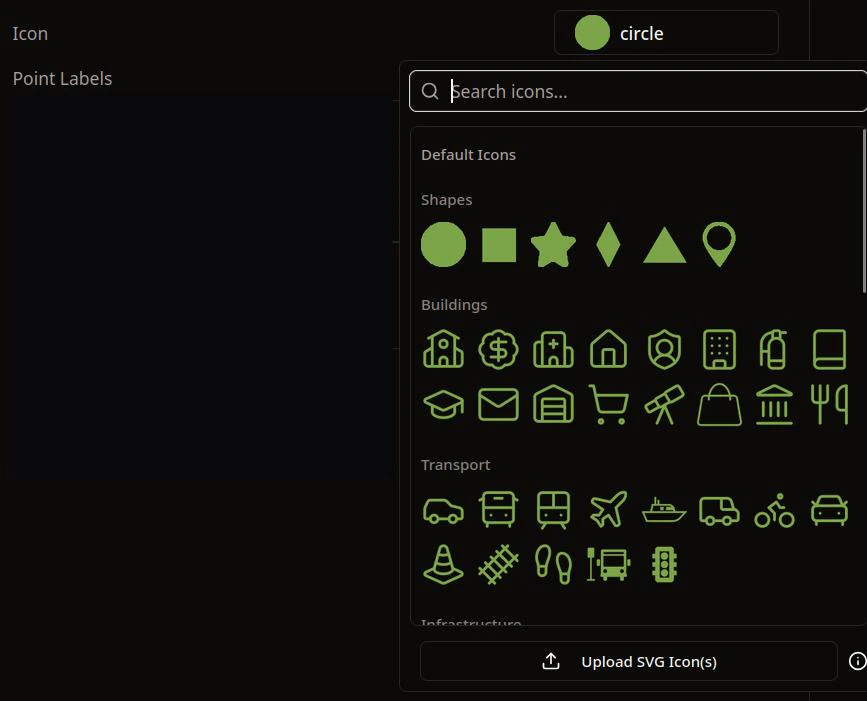
The icon picker provides a searchable library of icons organized by category.
### Default Icons
Browse grouped icon categories with visual previews. Icons render with the current icon color and anchor settings.
### Custom Icons
Upload your own SVG icons to use as point symbols. Custom icons can be renamed and deleted via the context menu. We recommend using [Lucide](https://lucide.dev) for custom SVG icons.
## Icon Library
The icon picker provides a searchable library of icons organized by category.
### Default Icons
Browse grouped icon categories with visual previews. Icons render with the current icon color and anchor settings.
### Custom Icons
Upload your own SVG icons to use as point symbols. Custom icons can be renamed and deleted via the context menu. We recommend using [Lucide](https://lucide.dev) for custom SVG icons.
 ## Auto-Save Feature
All styling changes are **automatically saved** for future sessions:
* **Settings persist** when you close and reopen the map
* **No manual saving** required
* **Consistent appearance** across sessions
* **Team collaboration** benefits from saved settings
## Best Practices
### Choose Appropriate Styling by Geometry
* **Polygon layers**: Use fill color modes (Solid, Gradient, Unique Values) combined with elevation for 3D effects
* **Line layers**: Adjust width, dash patterns, and color modes to distinguish different line features
* **Point layers**: Combine icon selection, sizing modes, and text labels for maximum clarity
### Color Modes
* **Solid**: Best for layers where all features represent the same category
* **Gradient**: Best for continuous numeric data like population density, temperature, or elevation
* **Unique Values**: Best for categorical data like land use types, status codes, or region names
### Text Labels
* **Enable text background** for better readability over complex base maps
* **Adjust outline color and width** to create contrast with the map underneath
* **Use the position grid** to avoid overlapping text with the icon itself
## Next Steps
* **Add More Layers**: Enhance your map with additional data
* **Publish Your Map**: Share your styled vector layers
## Auto-Save Feature
All styling changes are **automatically saved** for future sessions:
* **Settings persist** when you close and reopen the map
* **No manual saving** required
* **Consistent appearance** across sessions
* **Team collaboration** benefits from saved settings
## Best Practices
### Choose Appropriate Styling by Geometry
* **Polygon layers**: Use fill color modes (Solid, Gradient, Unique Values) combined with elevation for 3D effects
* **Line layers**: Adjust width, dash patterns, and color modes to distinguish different line features
* **Point layers**: Combine icon selection, sizing modes, and text labels for maximum clarity
### Color Modes
* **Solid**: Best for layers where all features represent the same category
* **Gradient**: Best for continuous numeric data like population density, temperature, or elevation
* **Unique Values**: Best for categorical data like land use types, status codes, or region names
### Text Labels
* **Enable text background** for better readability over complex base maps
* **Adjust outline color and width** to create contrast with the map underneath
* **Use the position grid** to avoid overlapping text with the icon itself
## Next Steps
* **Add More Layers**: Enhance your map with additional data
* **Publish Your Map**: Share your styled vector layers