> ## Documentation Index
> Fetch the complete documentation index at: https://docs.nikaplanet.com/llms.txt
> Use this file to discover all available pages before exploring further.
# Map Visualization Tutorial
> Learn how to create effective map visualizations with Nika in 7 simple steps
## Map Visualization Tutorial
This tutorial will guide you through creating a complete map visualization using Nika's powerful mapping tools. You'll learn how to create maps, add different types of data layers, and style them effectively to create compelling visualizations.
## What You'll Learn
By the end of this tutorial, you'll be able to:
* Create a new map from scratch
* Add vector, raster, and image data layers
* Style different layer types for optimal visualization
* Organize and manage your map layers
* Export your final visualization
## Prerequisites
Before starting, make sure you have:
* Access to NikaWorkspace
* Sample data files ready (we'll provide examples)
* A modern web browser
## Step 1: Create Your First Map
### Access NikaMap
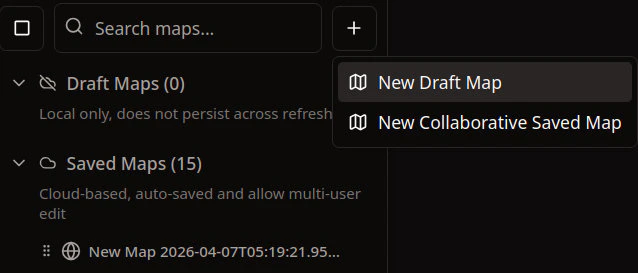
1. **Navigate to NikaMap**: In NikaWorkspace, click on the Globe icon in the left sidebar
2. **View Map List**: You'll see a list of your existing maps on the left panel
3. **Create New**: Click the "+" button and then the "New Map" button to create a new one
 ### Name Your Map
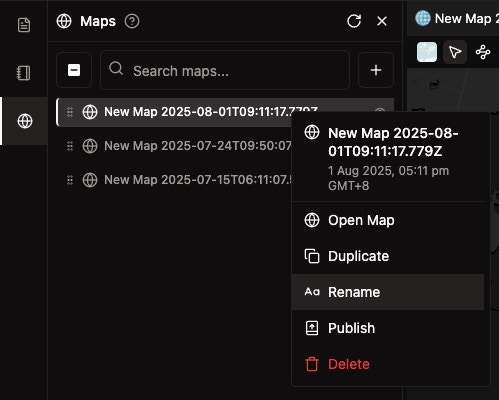
1. **Right-click** on your new map to open the rename dialog
2. **Enter a descriptive name** like "My Visualization Project"
3. **Click "Save"** to finalize
### Name Your Map
1. **Right-click** on your new map to open the rename dialog
2. **Enter a descriptive name** like "My Visualization Project"
3. **Click "Save"** to finalize
 **Pro Tip**: Use clear, descriptive names that will help you identify your map later.
## Step 2: Prepare Your Sample Data
For this tutorial, you'll need three types of sample data:
### Vector Data ([Download Sample File](https://drive.google.com/file/d/1vzdqgcTXbEGNS_Q_uuwQq00D3jLeD75c/view?usp=sharing))
* **GeoJSON file**: Contains point, line, or polygon features
* **Shapefile**: Traditional GIS vector format
* **CSV with coordinates**: Tabular data with latitude/longitude columns
### Raster Data ([Download Sample File](https://storage.cloud.google.com/raster-datasources/Hansen%20GFC%202023%20v1.11%2000N%20050W.tif?authuser=0))
* **GeoTIFF**: High-quality raster imagery or elevation data
* **COG**: Cloud optimized geotiff raster images with the same file extension as .tiff or .tif
### Image Data ([Download Sample File](https://www.globhe.com/sample-drone-data))
* **JPEG**: High-resolution images for overlay
**Download Sample Data**: Click links above to download if you do not have some of these formats to try in NikaMap
## Step 3: Add Vector Layers
### Upload Vector Data
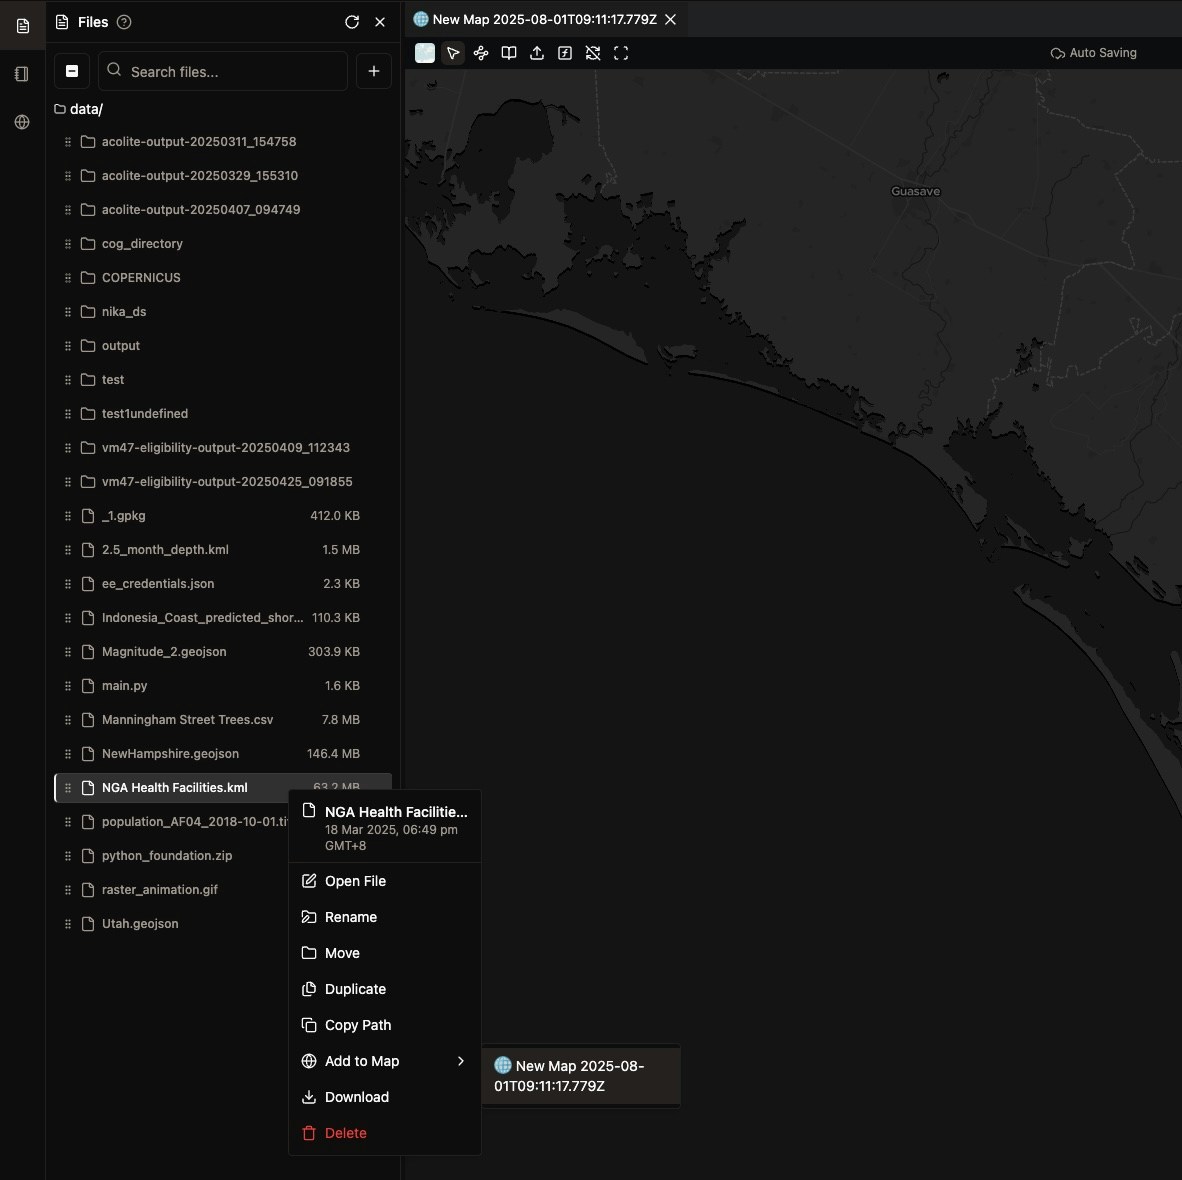
1. **Open Files Panel**: Click "Files" in the left sidebar
2. **Select your vector file** (GeoJSON, Shapefile, or CSV)
3. **Right-click** and select "Add to Map" with your map selected
4. **Wait for processing** - larger files may take a moment
**Pro Tip**: Use clear, descriptive names that will help you identify your map later.
## Step 2: Prepare Your Sample Data
For this tutorial, you'll need three types of sample data:
### Vector Data ([Download Sample File](https://drive.google.com/file/d/1vzdqgcTXbEGNS_Q_uuwQq00D3jLeD75c/view?usp=sharing))
* **GeoJSON file**: Contains point, line, or polygon features
* **Shapefile**: Traditional GIS vector format
* **CSV with coordinates**: Tabular data with latitude/longitude columns
### Raster Data ([Download Sample File](https://storage.cloud.google.com/raster-datasources/Hansen%20GFC%202023%20v1.11%2000N%20050W.tif?authuser=0))
* **GeoTIFF**: High-quality raster imagery or elevation data
* **COG**: Cloud optimized geotiff raster images with the same file extension as .tiff or .tif
### Image Data ([Download Sample File](https://www.globhe.com/sample-drone-data))
* **JPEG**: High-resolution images for overlay
**Download Sample Data**: Click links above to download if you do not have some of these formats to try in NikaMap
## Step 3: Add Vector Layers
### Upload Vector Data
1. **Open Files Panel**: Click "Files" in the left sidebar
2. **Select your vector file** (GeoJSON, Shapefile, or CSV)
3. **Right-click** and select "Add to Map" with your map selected
4. **Wait for processing** - larger files may take a moment
 ### Verify Layer Addition
* **Check the layers panel** on the left side
* **Your vector layer** should appear in the list
* **Layer will be visible** on the map automatically
## Step 4: Style Your Vector Layers
### Access Vector Styling
1. **Right-click** on your vector layer in the layers panel
2. **Select "Layer Styles"** from the context menu
3. **Styling panel opens** with customization options
### Verify Layer Addition
* **Check the layers panel** on the left side
* **Your vector layer** should appear in the list
* **Layer will be visible** on the map automatically
## Step 4: Style Your Vector Layers
### Access Vector Styling
1. **Right-click** on your vector layer in the layers panel
2. **Select "Layer Styles"** from the context menu
3. **Styling panel opens** with customization options
 ### Customize Vector Appearance
#### For Point Layers:
* **Icon Color**: Set point symbol color using the color picker
* **Opacity**: Adjust transparency (0-100%)
#### For Line Layers:
* **Line Color**: Choose line color from the color picker
* **Line Width**: Set thickness using the slider (in pixels)
* **Opacity**: Control transparency
#### For Polygon Layers:
* **Fill Color**: Set interior color of polygons
* **Opacity**: Adjust fill transparency
* **Line Color/Width**: Customize polygon borders
### Layer Organization
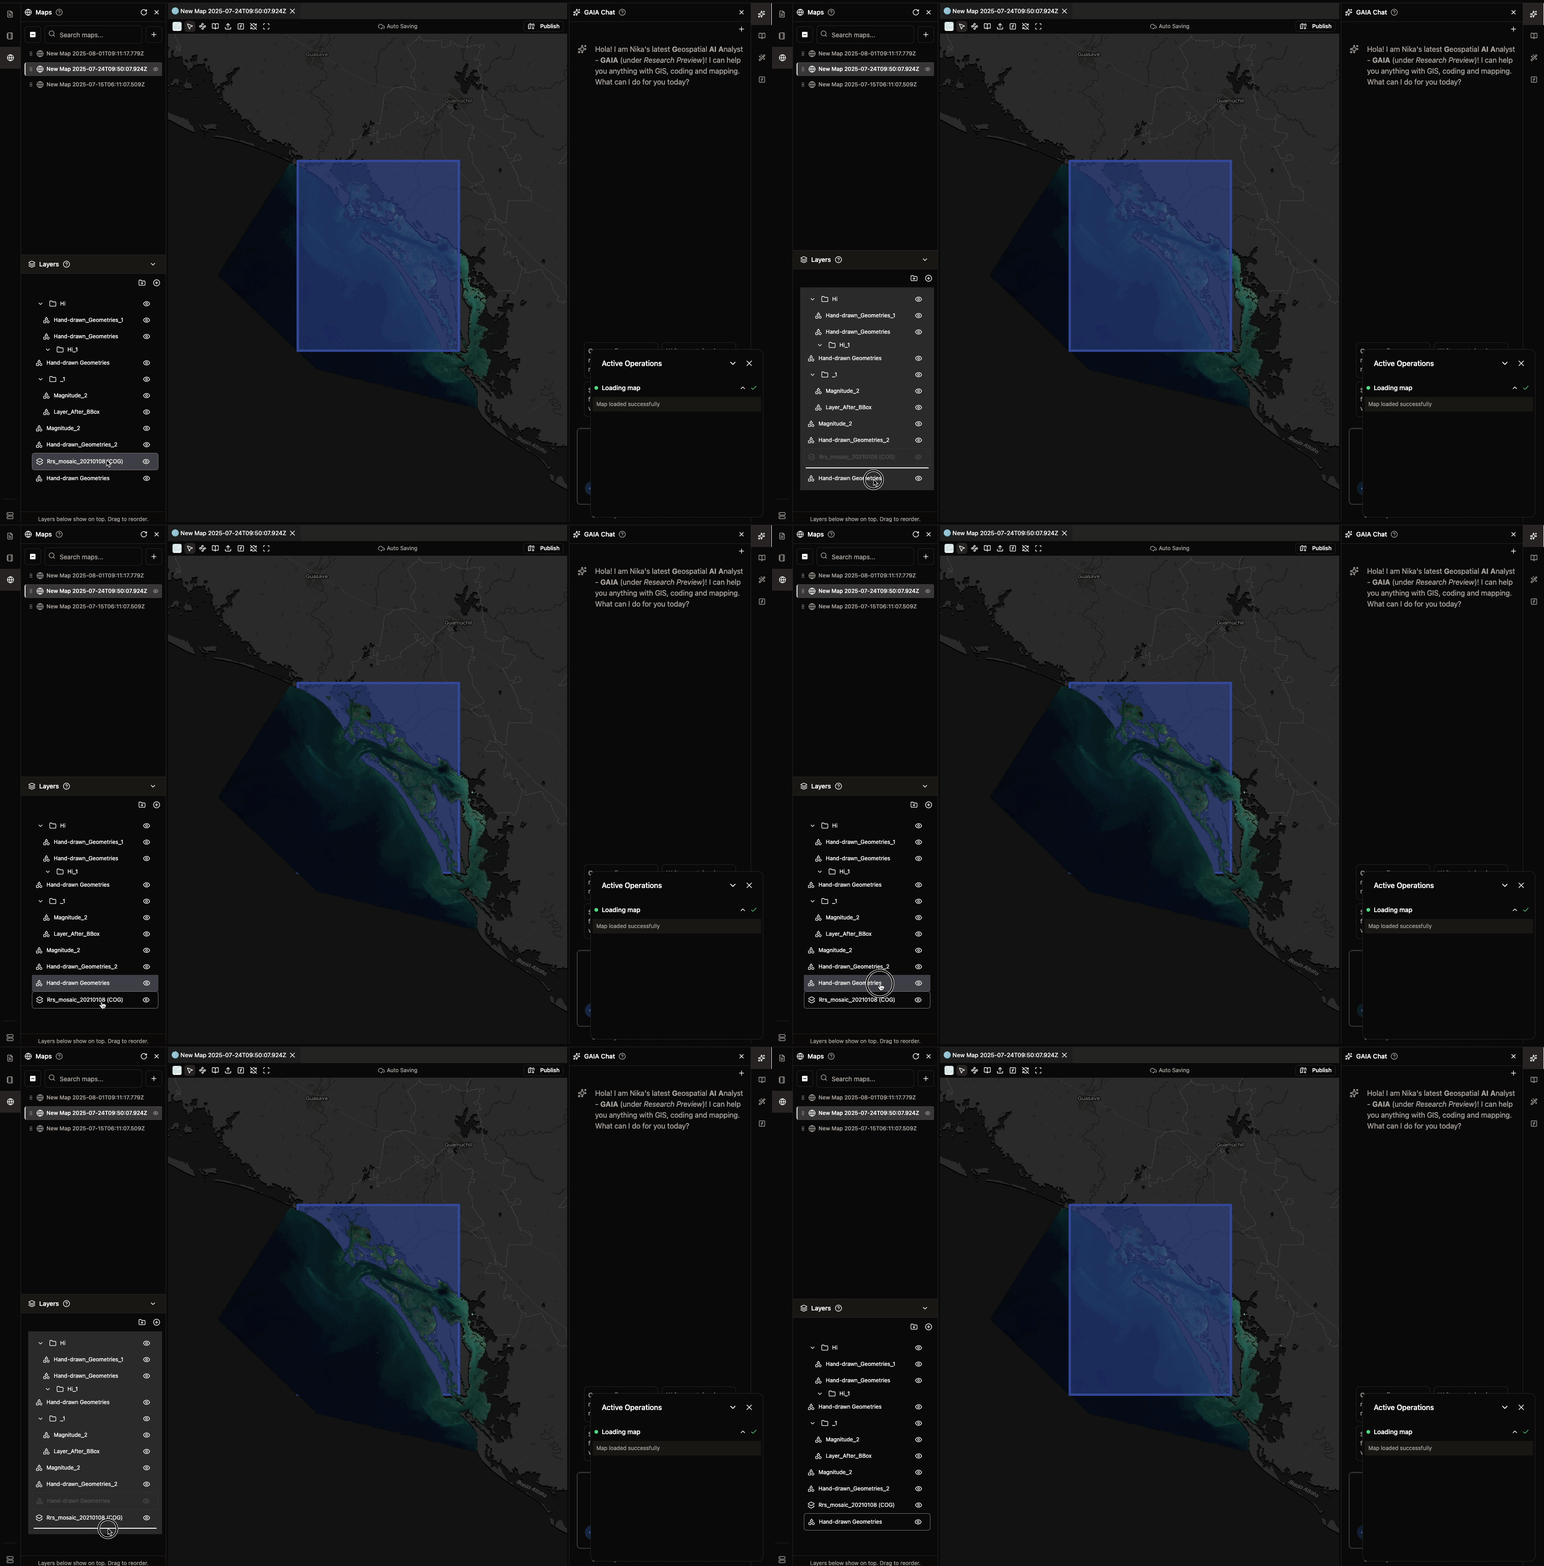
* **Reorder layers** by dragging them in the layers panel
* **Bottom layers** appear on top of the map
* **Toggle visibility** using the eye icon
### Customize Vector Appearance
#### For Point Layers:
* **Icon Color**: Set point symbol color using the color picker
* **Opacity**: Adjust transparency (0-100%)
#### For Line Layers:
* **Line Color**: Choose line color from the color picker
* **Line Width**: Set thickness using the slider (in pixels)
* **Opacity**: Control transparency
#### For Polygon Layers:
* **Fill Color**: Set interior color of polygons
* **Opacity**: Adjust fill transparency
* **Line Color/Width**: Customize polygon borders
### Layer Organization
* **Reorder layers** by dragging them in the layers panel
* **Bottom layers** appear on top of the map
* **Toggle visibility** using the eye icon
 ## Step 5: Add and Style Raster Layers
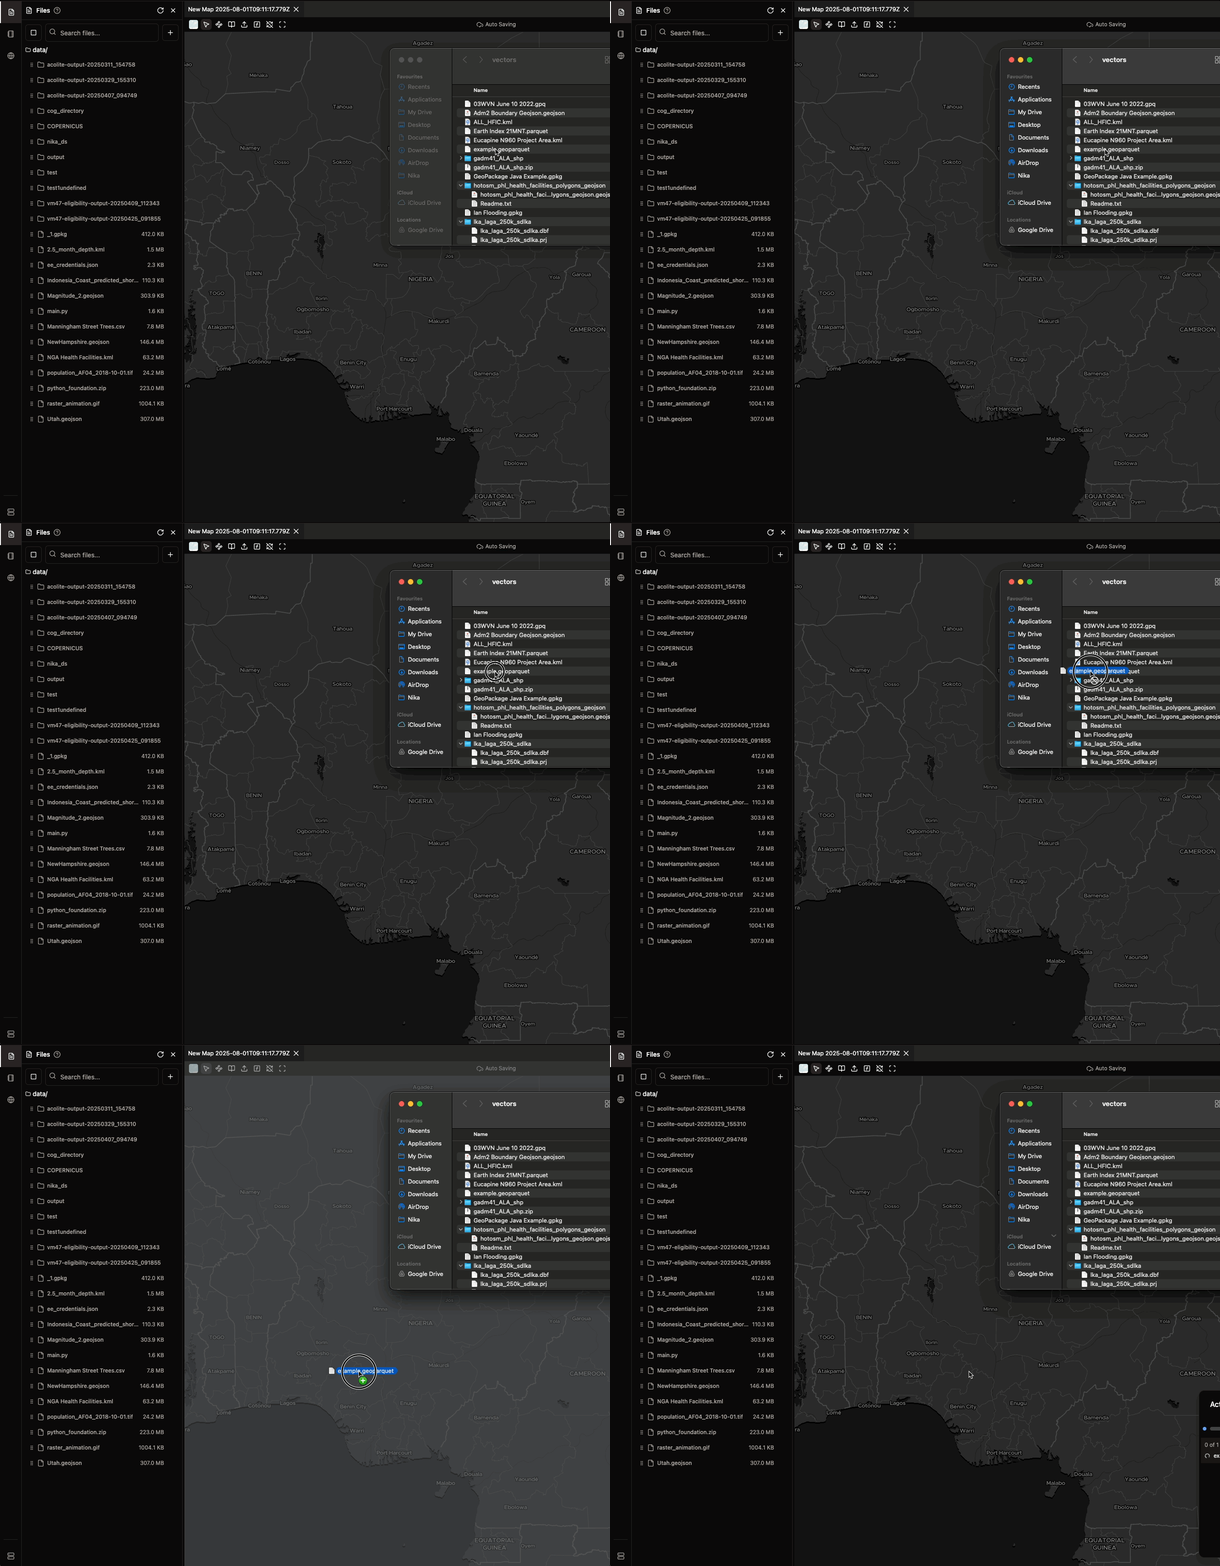
### Upload Raster Data
1. **Select your raster file** (GeoTIFF, JPEG with georeference)
2. **Add to map** drag the .tiff file from your desktop into middle section of the opened NikaMap to upload it directly
3. **Wait for processing** - raster files may take longer
## Step 5: Add and Style Raster Layers
### Upload Raster Data
1. **Select your raster file** (GeoTIFF, JPEG with georeference)
2. **Add to map** drag the .tiff file from your desktop into middle section of the opened NikaMap to upload it directly
3. **Wait for processing** - raster files may take longer
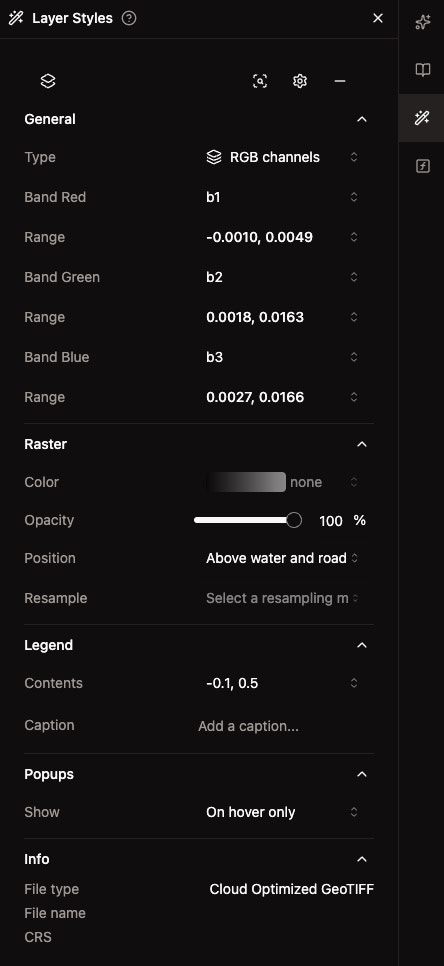
 ### Access Raster Styling
1. **Right-click** on your raster layer
2. **Select "Layer Styles"** to open the styling panel
### Access Raster Styling
1. **Right-click** on your raster layer
2. **Select "Layer Styles"** to open the styling panel
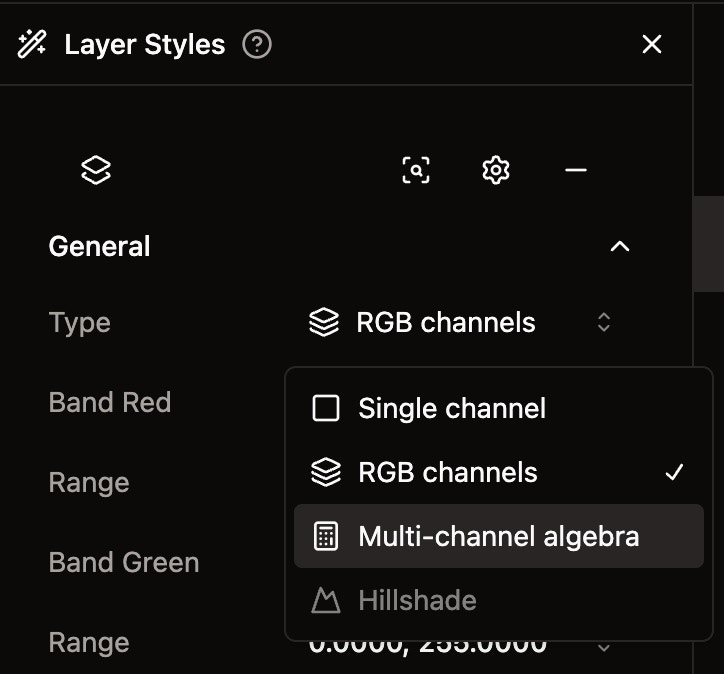
 ### Choose Visualization Type
#### Single Channel Mode:
* **Select one band** (b1, b2, b3, etc.)
* **Set data range** using min/max sliders
* **Apply color map** (grayscale, blues, greens, etc.)
#### RGB Channels Mode:
* **Assign bands** to Red, Green, and Blue channels
* **Set individual ranges** for each color channel
* **Create natural or false color** composites
### Choose Visualization Type
#### Single Channel Mode:
* **Select one band** (b1, b2, b3, etc.)
* **Set data range** using min/max sliders
* **Apply color map** (grayscale, blues, greens, etc.)
#### RGB Channels Mode:
* **Assign bands** to Red, Green, and Blue channels
* **Set individual ranges** for each color channel
* **Create natural or false color** composites
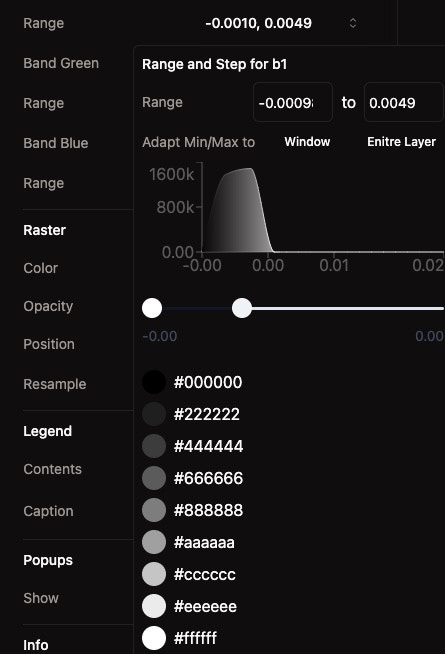
 ### Adjust Data Range
1. **View histogram** showing data distribution
2. **Drag sliders** to set optimal min/max values
3. **See real-time updates** on the map
### Adjust Data Range
1. **View histogram** showing data distribution
2. **Drag sliders** to set optimal min/max values
3. **See real-time updates** on the map
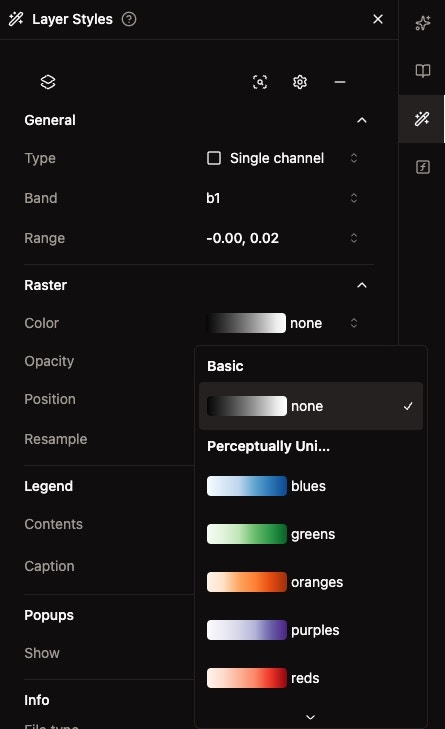
 ### Select Color Maps
Choose from various color schemes:
* **Grayscale**: For general data visualization
* **Sequential colors**: For continuous data (elevation, temperature)
* **Specialized**: Rainbow, Viridis, Plasma for complex data
### Select Color Maps
Choose from various color schemes:
* **Grayscale**: For general data visualization
* **Sequential colors**: For continuous data (elevation, temperature)
* **Specialized**: Rainbow, Viridis, Plasma for complex data
 ## Step 6: Add Image Overlays
### Upload Image Data
1. **Select your image file** (JPEG, PNG)
2. **Add to map** using drag-and-drop or right-click
3. **Position appropriately** in the layer stack
### Image Layer Management
* **Adjust opacity** to blend with underlying layers
* **Reorder layers** to control stacking
* **Toggle visibility** as needed
## Step 7: Finalize Your Visualization
### Layer Organization
1. **Arrange layers logically**: Background to foreground
2. **Set appropriate opacity** for each layer
3. **Ensure proper stacking order**
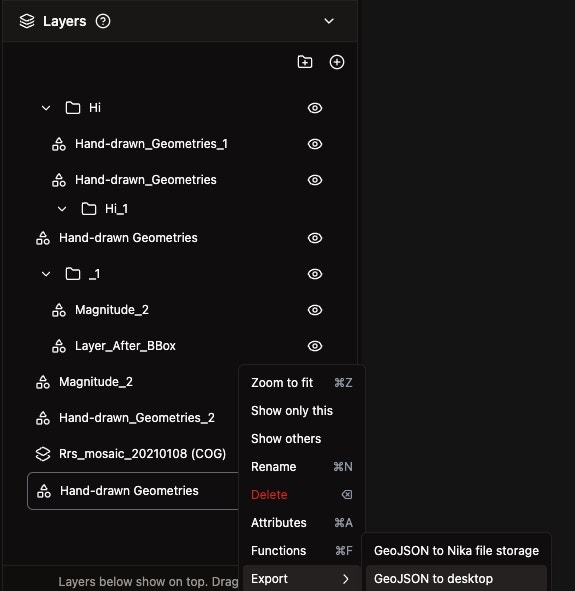
### Export Your Map
1. **Right-click** on individual vector layers to export as GeoJSON
2. **Right-click** on layer groups to export as GeoPackage
3. **Choose destination**: Desktop or NikaWorkspace storage
## Step 6: Add Image Overlays
### Upload Image Data
1. **Select your image file** (JPEG, PNG)
2. **Add to map** using drag-and-drop or right-click
3. **Position appropriately** in the layer stack
### Image Layer Management
* **Adjust opacity** to blend with underlying layers
* **Reorder layers** to control stacking
* **Toggle visibility** as needed
## Step 7: Finalize Your Visualization
### Layer Organization
1. **Arrange layers logically**: Background to foreground
2. **Set appropriate opacity** for each layer
3. **Ensure proper stacking order**
### Export Your Map
1. **Right-click** on individual vector layers to export as GeoJSON
2. **Right-click** on layer groups to export as GeoPackage
3. **Choose destination**: Desktop or NikaWorkspace storage
 ### Share Your Visualization
* **Publish your map** for public sharing
* **Collaborate** with team members
* **Export high-resolution** images for presentations
## Best Practices for Map Visualization
### Data Preparation
* **Use appropriate file formats** for your data type
* **Ensure proper coordinate systems** (will auto-convert to EPSG:3857)
* **Keep file sizes reasonable** for optimal performance
### Visual Design
* **Choose complementary colors** for different layer types
* **Use opacity effectively** to show multiple layers
* **Consider colorblind-friendly** color schemes when possible
### Performance Optimization
* **Limit the number** of simultaneous layers
* **Simplify complex geometries** when possible
* **Use appropriate zoom levels** for detailed data
### Layer Management
* **Use descriptive names** for all layers
* **Group related layers** together
* **Remove unused layers** to keep maps clean
## Troubleshooting Common Issues
### Layer Not Appearing
* **Check visibility**: Ensure the eye icon is enabled
* **Zoom to layer**: Double-click layer name to zoom to extent
* **Verify coordinate system**: Data should have proper spatial reference
### Performance Issues
* **Reduce file sizes**: Simplify large datasets
* **Limit active layers**: Hide unnecessary layers
* **Refresh browser**: Clear cache if needed
### Styling Problems
* **Reset styling**: Use reset button in styling panel
* **Check data ranges**: Ensure min/max values are appropriate
* **Verify layer order**: Ensure proper stacking
## Next Steps
Now that you've mastered basic map visualization:
1. **Explore Advanced Styling**: Learn about attribute-based styling and custom color schemes
2. **Create Interactive Maps**: Add popups and interactive features
3. **Collaborative Mapping**: Work with team members on shared projects
4. **Publish and Share**: Make your visualizations public
Happy visualizing!
### Share Your Visualization
* **Publish your map** for public sharing
* **Collaborate** with team members
* **Export high-resolution** images for presentations
## Best Practices for Map Visualization
### Data Preparation
* **Use appropriate file formats** for your data type
* **Ensure proper coordinate systems** (will auto-convert to EPSG:3857)
* **Keep file sizes reasonable** for optimal performance
### Visual Design
* **Choose complementary colors** for different layer types
* **Use opacity effectively** to show multiple layers
* **Consider colorblind-friendly** color schemes when possible
### Performance Optimization
* **Limit the number** of simultaneous layers
* **Simplify complex geometries** when possible
* **Use appropriate zoom levels** for detailed data
### Layer Management
* **Use descriptive names** for all layers
* **Group related layers** together
* **Remove unused layers** to keep maps clean
## Troubleshooting Common Issues
### Layer Not Appearing
* **Check visibility**: Ensure the eye icon is enabled
* **Zoom to layer**: Double-click layer name to zoom to extent
* **Verify coordinate system**: Data should have proper spatial reference
### Performance Issues
* **Reduce file sizes**: Simplify large datasets
* **Limit active layers**: Hide unnecessary layers
* **Refresh browser**: Clear cache if needed
### Styling Problems
* **Reset styling**: Use reset button in styling panel
* **Check data ranges**: Ensure min/max values are appropriate
* **Verify layer order**: Ensure proper stacking
## Next Steps
Now that you've mastered basic map visualization:
1. **Explore Advanced Styling**: Learn about attribute-based styling and custom color schemes
2. **Create Interactive Maps**: Add popups and interactive features
3. **Collaborative Mapping**: Work with team members on shared projects
4. **Publish and Share**: Make your visualizations public
Happy visualizing!