 ## River Basin Urban Development Analyzer
Processes satellite imagery (built-up, water, NDVI) to analyze urban development patterns across multiple regions, generating statistical summaries, comparison plots, and detailed land use classifications.
## Requirements
| Requirement | Details |
| ------------------- | ------------------------------------------------------------------------- |
| **Software** | Python 3.x, rasterio, matplotlib, pandas, numpy |
| **Data Sources** | Pre-downloaded satellite imagery (Built-up, Water, NDVI, Satellite) |
| **Python Packages** | rasterio, numpy, pandas, matplotlib, seaborn, geopandas, shapely, pathlib |
## Input Data
TIF files for each region: `*_buildup.tif`, `*_water.tif`, `*_ndvi.tif`, `*_satellite.tif`
## Files Created
| Filename | Description | Format |
| ------------------------------------ | -------------------------------------------- | ------------- |
| **region\_summary.csv** | Statistical summary for all analyzed regions | CSV |
| **comparison\_analysis.png** | 4-panel comparison plots across all regions | PNG (300 DPI) |
| **{region}\_detailed\_analysis.png** | Detailed 4-panel analysis for each region | PNG (300 DPI) |
| **analysis\_report.md** | Comprehensive markdown report with insights | Markdown |
## High-Level Workflow Steps
### 1. Region Discovery & Data Loading
Auto-discover regions from `*_buildup.tif` files in data directory
Load corresponding water, NDVI, and satellite imagery for each region
Handle nodata values and coordinate transformations
### 2. Statistical Analysis
Calculate built-up area coverage and intensity (hectares & percentages)
Analyze water occurrence (permanent vs seasonal water bodies)
Compute vegetation indices (NDVI-based green cover analysis)
Generate composite land use statistics
### 3. Urban Classification
* **Dense Urban**: >50% built-up coverage
* **Moderate Urban**: 25-50% built-up coverage
* **Low Urban**: 10-25% built-up coverage
* **Rural/Natural**: \<10% built-up coverage
### 4. Visualization Generation
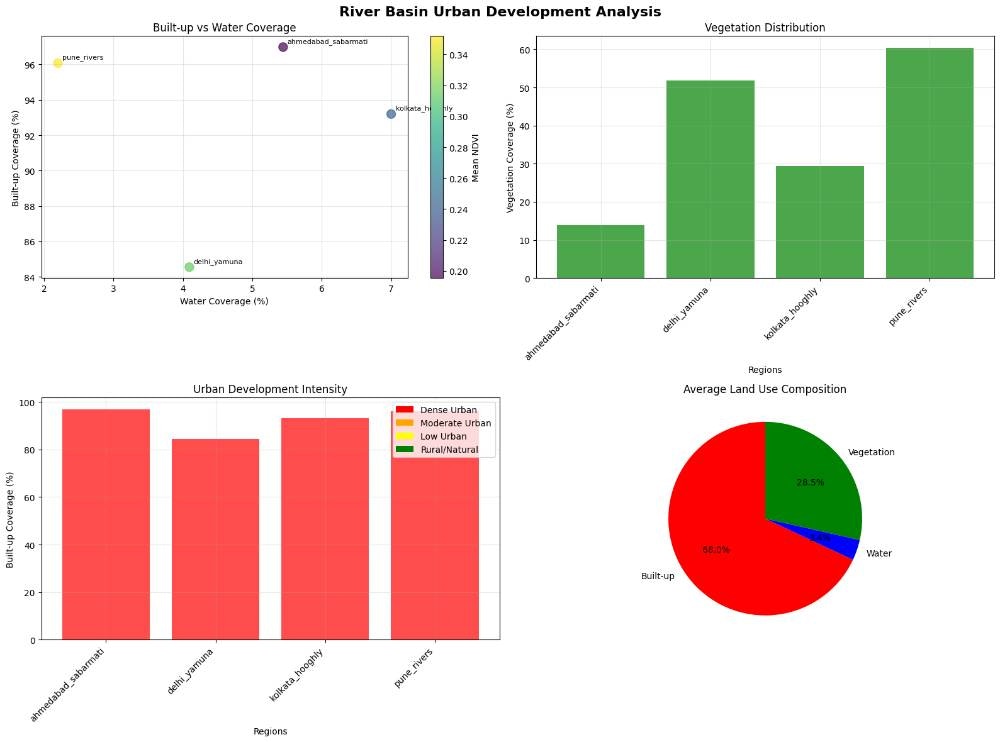
**Comparison Plots**: 4-panel matplotlib figure with scatter plots, bar charts, and pie charts
**Regional Details**: Individual 4-panel analysis showing built-up, water, NDVI, and land use classification
**Static PNG Output**: High-resolution images suitable for reports and publications
### 5. Report Generation
Regional rankings (most urbanized, highest water coverage, most vegetated)
Key insights and development patterns
Comprehensive data tables with all calculated metrics
## Output Analysis Capabilities
This script generates comprehensive urban development assessment using:
* **Built-up Intensity Maps** - Identifies urban development patterns and density
* **Water Occurrence Analysis** - Distinguishes permanent vs seasonal water bodies
* **Vegetation Health (NDVI)** - Maps green cover and vegetation density
* **Land Use Classification** - Composite analysis of urban, water, vegetation, and other land uses
## Visualization Outputs
### Comparison Analysis (4-Panel Plot)
* **Built-up vs Water Coverage Scatter** - Shows relationship between urbanization and water presence (colored by NDVI)
* **Vegetation Distribution Bar Chart** - Compares green cover across all regions
* **Urban Development Intensity** - Color-coded by urban classification (Dense/Moderate/Low/Rural)
* **Average Land Use Pie Chart** - Overall composition of built-up, water, vegetation, and other land uses
### Detailed Regional Analysis (Per Region)
* **Built-up Areas Map** - Red intensity showing urban development density
* **Water Occurrence Map** - Blue gradient showing water body frequency (0-100%)
* **Vegetation Index (NDVI)** - Green-red gradient showing vegetation health (-0.2 to 0.8)
* **Land Use Classification** - Categorical map (Urban=Red, Water=Blue, Vegetation=Green, Other=Black)
## Key Metrics Calculated
| Category | Metrics |
| -------------- | ----------------------------------------------------------------------------------------------- |
| **Built-up** | Mean intensity, max intensity, total area (ha), high-density area (ha), percentage coverage |
| **Water** | Mean occurrence, permanent water area (>80%), seasonal water area (20-80%), percentage coverage |
| **Vegetation** | Mean NDVI, vegetation area (>0.3), dense vegetation (>0.5), bare soil area, percentage coverage |
| **Composite** | Total area, urban classification, development patterns, land use ratios |
## Analysis Insights Generated
* **Urban Pressure Assessment** - Identifies regions with high development pressure
* **Water Resource Mapping** - Quantifies permanent vs seasonal water availability
* **Green Space Evaluation** - Measures vegetation cover and ecological health
* **Development Patterns** - Reveals relationships between urbanization and environmental factors
## Result
Multi-scale urban development analysis with both regional comparisons and detailed local assessments for sustainable planning and environmental monitoring.
## Output
### Quick Summary
| region | buildup\_percentage | water\_percentage | urban\_class |
| -------------------- | ------------------- | ----------------- | ------------ |
| ahmedabad\_sabarmati | 96.981293 | 5.442177 | Dense Urban |
| delhi\_yamuna | 84.551857 | 4.091872 | Dense Urban |
| kolkata\_hooghly | 93.197279 | 6.998953 | Dense Urban |
| pune\_rivers | 96.072101 | 2.199354 | Dense Urban |
***
## River Basin Urban Development Analyzer
Processes satellite imagery (built-up, water, NDVI) to analyze urban development patterns across multiple regions, generating statistical summaries, comparison plots, and detailed land use classifications.
## Requirements
| Requirement | Details |
| ------------------- | ------------------------------------------------------------------------- |
| **Software** | Python 3.x, rasterio, matplotlib, pandas, numpy |
| **Data Sources** | Pre-downloaded satellite imagery (Built-up, Water, NDVI, Satellite) |
| **Python Packages** | rasterio, numpy, pandas, matplotlib, seaborn, geopandas, shapely, pathlib |
## Input Data
TIF files for each region: `*_buildup.tif`, `*_water.tif`, `*_ndvi.tif`, `*_satellite.tif`
## Files Created
| Filename | Description | Format |
| ------------------------------------ | -------------------------------------------- | ------------- |
| **region\_summary.csv** | Statistical summary for all analyzed regions | CSV |
| **comparison\_analysis.png** | 4-panel comparison plots across all regions | PNG (300 DPI) |
| **{region}\_detailed\_analysis.png** | Detailed 4-panel analysis for each region | PNG (300 DPI) |
| **analysis\_report.md** | Comprehensive markdown report with insights | Markdown |
## High-Level Workflow Steps
### 1. Region Discovery & Data Loading
Auto-discover regions from `*_buildup.tif` files in data directory
Load corresponding water, NDVI, and satellite imagery for each region
Handle nodata values and coordinate transformations
### 2. Statistical Analysis
Calculate built-up area coverage and intensity (hectares & percentages)
Analyze water occurrence (permanent vs seasonal water bodies)
Compute vegetation indices (NDVI-based green cover analysis)
Generate composite land use statistics
### 3. Urban Classification
* **Dense Urban**: >50% built-up coverage
* **Moderate Urban**: 25-50% built-up coverage
* **Low Urban**: 10-25% built-up coverage
* **Rural/Natural**: \<10% built-up coverage
### 4. Visualization Generation
**Comparison Plots**: 4-panel matplotlib figure with scatter plots, bar charts, and pie charts
**Regional Details**: Individual 4-panel analysis showing built-up, water, NDVI, and land use classification
**Static PNG Output**: High-resolution images suitable for reports and publications
### 5. Report Generation
Regional rankings (most urbanized, highest water coverage, most vegetated)
Key insights and development patterns
Comprehensive data tables with all calculated metrics
## Output Analysis Capabilities
This script generates comprehensive urban development assessment using:
* **Built-up Intensity Maps** - Identifies urban development patterns and density
* **Water Occurrence Analysis** - Distinguishes permanent vs seasonal water bodies
* **Vegetation Health (NDVI)** - Maps green cover and vegetation density
* **Land Use Classification** - Composite analysis of urban, water, vegetation, and other land uses
## Visualization Outputs
### Comparison Analysis (4-Panel Plot)
* **Built-up vs Water Coverage Scatter** - Shows relationship between urbanization and water presence (colored by NDVI)
* **Vegetation Distribution Bar Chart** - Compares green cover across all regions
* **Urban Development Intensity** - Color-coded by urban classification (Dense/Moderate/Low/Rural)
* **Average Land Use Pie Chart** - Overall composition of built-up, water, vegetation, and other land uses
### Detailed Regional Analysis (Per Region)
* **Built-up Areas Map** - Red intensity showing urban development density
* **Water Occurrence Map** - Blue gradient showing water body frequency (0-100%)
* **Vegetation Index (NDVI)** - Green-red gradient showing vegetation health (-0.2 to 0.8)
* **Land Use Classification** - Categorical map (Urban=Red, Water=Blue, Vegetation=Green, Other=Black)
## Key Metrics Calculated
| Category | Metrics |
| -------------- | ----------------------------------------------------------------------------------------------- |
| **Built-up** | Mean intensity, max intensity, total area (ha), high-density area (ha), percentage coverage |
| **Water** | Mean occurrence, permanent water area (>80%), seasonal water area (20-80%), percentage coverage |
| **Vegetation** | Mean NDVI, vegetation area (>0.3), dense vegetation (>0.5), bare soil area, percentage coverage |
| **Composite** | Total area, urban classification, development patterns, land use ratios |
## Analysis Insights Generated
* **Urban Pressure Assessment** - Identifies regions with high development pressure
* **Water Resource Mapping** - Quantifies permanent vs seasonal water availability
* **Green Space Evaluation** - Measures vegetation cover and ecological health
* **Development Patterns** - Reveals relationships between urbanization and environmental factors
## Result
Multi-scale urban development analysis with both regional comparisons and detailed local assessments for sustainable planning and environmental monitoring.
## Output
### Quick Summary
| region | buildup\_percentage | water\_percentage | urban\_class |
| -------------------- | ------------------- | ----------------- | ------------ |
| ahmedabad\_sabarmati | 96.981293 | 5.442177 | Dense Urban |
| delhi\_yamuna | 84.551857 | 4.091872 | Dense Urban |
| kolkata\_hooghly | 93.197279 | 6.998953 | Dense Urban |
| pune\_rivers | 96.072101 | 2.199354 | Dense Urban |
***
Access the complete code, step-by-step instructions, and interactive notebook in Nika Hub.
View Full Solution →