 ## Riparian Zone Urbanization Gradients
This project performs an analysis of riparian zone urbanization gradients near the Amazon River, specifically focusing on a defined area near Manaus. It quantifies how built-up surface density changes with increasing distance from river systems, providing insights into human impact on riparian ecosystems.
## Resources Needed
### Software
* Python 3.x
### Libraries
* **earthengine-api**: For interacting with Google Earth Engine
* **pandas**: For data manipulation and analysis
* **matplotlib**: For creating static, interactive, and animated visualizations in Python
* **numpy**: For numerical operations
* **seaborn**: For statistical data visualization
* **Pillow (PIL)**: For image processing
* **requests**: For making HTTP requests (e.g., downloading images)
### Google Earth Engine Account
An active Google Earth Engine account is required to access the spatial datasets.
### Internet Connection
Essential for accessing Earth Engine data and services.
## Input Files
This project does not require explicit input files from your local machine. All necessary spatial data is accessed directly from the Google Earth Engine data catalog:
* **WWF/HydroSHEDS/v1/FreeFlowingRivers**: Global dataset of free-flowing rivers
* **JRC/GHSL/P2023A/GHS\_BUILT\_S**: Global Human Settlement Layer (GHSL) Built-up Surface dataset for 2020
* **FAO/GAUL/2015/level2** (Optional): Administrative boundaries used if the AOI is defined by an administrative name (not used in the provided code's default AOI)
## Output Files
The project generates output files within a newly created output folder:
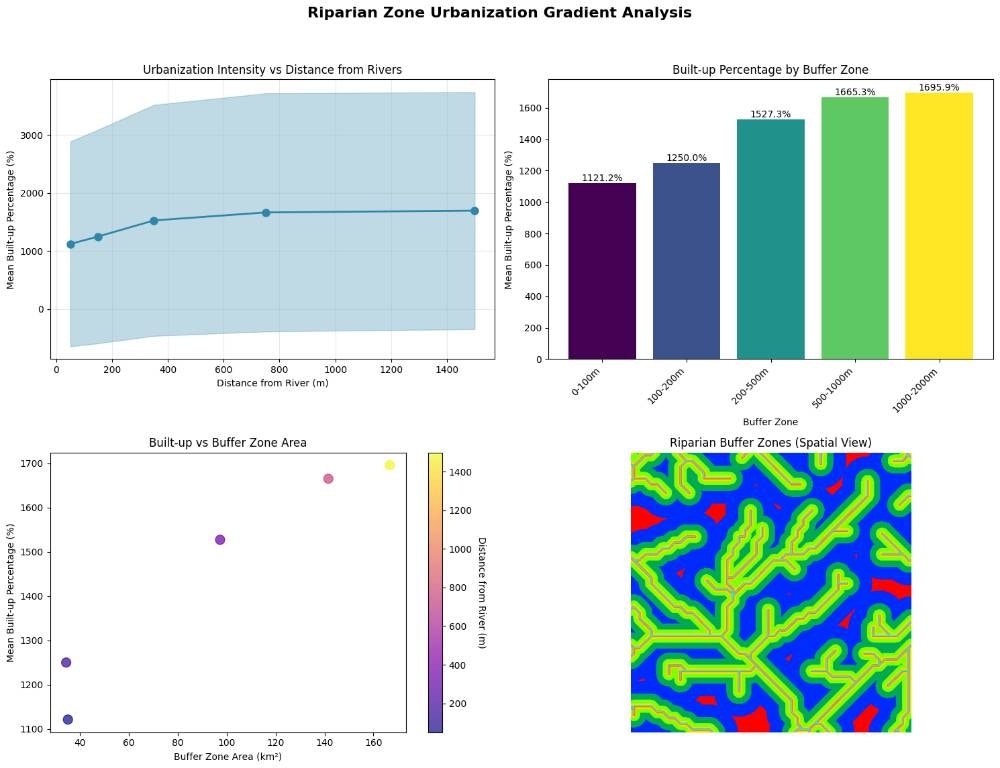
* **riparian\_amazon\_analysis\_YYYYMMDD\_HHMMSS.png**: A high-resolution PNG image of the generated plots, visualizing the urbanization gradient and the spatial distribution of buffer zones
* **riparian\_amazon\_results\_YYYYMMDD\_HHMMSS.csv**: A CSV file containing the detailed urbanization metrics for each riparian buffer zone, including area, mean built-up percentage, and standard deviation
* **riparian\_amazon\_summary\_YYYYMMDD\_HHMMSS.txt**: A text file providing a summary report of the analysis, including key statistics, correlations, and a breakdown of built-up percentages per zone
## Step-by-Step Analysis
### 1. Initialize Earth Engine
Authenticate and initialize the Google Earth Engine API to enable data access.
### 2. Define Area of Interest (AOI)
Specify the geographical region for the analysis, in this case, a rectangle near Manaus, Amazon River.
### 3. Load Datasets
Import the HydroRIVERS dataset for river networks and the GHSL Built-up Surface dataset for urbanization data from Earth Engine.
### 4. Filter Rivers
Clip and filter the global HydroRIVERS dataset to retain only the river segments within the defined AOI.
### 5. Create Buffer Zones
Generate non-overlapping buffer rings around the filtered river segments at specified distances (e.g., 0-100m, 100-200m, etc.).
### 6. Extract Urbanization Metrics
For each buffer zone, calculate descriptive statistics (mean, standard deviation, min, max, pixel count) of the built-up surface percentage using the GHSL data.
### 7. Create Results DataFrame
Organize the extracted urbanization metrics into a pandas DataFrame, adding columns for distance ranges and midpoints for easier analysis.
### 8. Generate Buffer Map Image
Create a static thumbnail image from Earth Engine visualizing the defined buffer zones and rivers within the AOI, with distinct colors for each zone.
### 9. Visualize Gradient
Generate a multi-panel plot including a line plot of urbanization intensity vs. distance, a bar chart of built-up percentages per zone, a scatter plot of area vs. built-up, and the generated buffer map image.
### 10. Perform Statistical Analysis
Calculate key statistics, such as correlation between distance and built-up density, and the average gradient slope, to quantify the urbanization pattern.
### 11. Export Results
Save the detailed results DataFrame to a CSV file, and generate a comprehensive summary report as a text file in a dedicated output folder.
***
## Riparian Zone Urbanization Gradients
This project performs an analysis of riparian zone urbanization gradients near the Amazon River, specifically focusing on a defined area near Manaus. It quantifies how built-up surface density changes with increasing distance from river systems, providing insights into human impact on riparian ecosystems.
## Resources Needed
### Software
* Python 3.x
### Libraries
* **earthengine-api**: For interacting with Google Earth Engine
* **pandas**: For data manipulation and analysis
* **matplotlib**: For creating static, interactive, and animated visualizations in Python
* **numpy**: For numerical operations
* **seaborn**: For statistical data visualization
* **Pillow (PIL)**: For image processing
* **requests**: For making HTTP requests (e.g., downloading images)
### Google Earth Engine Account
An active Google Earth Engine account is required to access the spatial datasets.
### Internet Connection
Essential for accessing Earth Engine data and services.
## Input Files
This project does not require explicit input files from your local machine. All necessary spatial data is accessed directly from the Google Earth Engine data catalog:
* **WWF/HydroSHEDS/v1/FreeFlowingRivers**: Global dataset of free-flowing rivers
* **JRC/GHSL/P2023A/GHS\_BUILT\_S**: Global Human Settlement Layer (GHSL) Built-up Surface dataset for 2020
* **FAO/GAUL/2015/level2** (Optional): Administrative boundaries used if the AOI is defined by an administrative name (not used in the provided code's default AOI)
## Output Files
The project generates output files within a newly created output folder:
* **riparian\_amazon\_analysis\_YYYYMMDD\_HHMMSS.png**: A high-resolution PNG image of the generated plots, visualizing the urbanization gradient and the spatial distribution of buffer zones
* **riparian\_amazon\_results\_YYYYMMDD\_HHMMSS.csv**: A CSV file containing the detailed urbanization metrics for each riparian buffer zone, including area, mean built-up percentage, and standard deviation
* **riparian\_amazon\_summary\_YYYYMMDD\_HHMMSS.txt**: A text file providing a summary report of the analysis, including key statistics, correlations, and a breakdown of built-up percentages per zone
## Step-by-Step Analysis
### 1. Initialize Earth Engine
Authenticate and initialize the Google Earth Engine API to enable data access.
### 2. Define Area of Interest (AOI)
Specify the geographical region for the analysis, in this case, a rectangle near Manaus, Amazon River.
### 3. Load Datasets
Import the HydroRIVERS dataset for river networks and the GHSL Built-up Surface dataset for urbanization data from Earth Engine.
### 4. Filter Rivers
Clip and filter the global HydroRIVERS dataset to retain only the river segments within the defined AOI.
### 5. Create Buffer Zones
Generate non-overlapping buffer rings around the filtered river segments at specified distances (e.g., 0-100m, 100-200m, etc.).
### 6. Extract Urbanization Metrics
For each buffer zone, calculate descriptive statistics (mean, standard deviation, min, max, pixel count) of the built-up surface percentage using the GHSL data.
### 7. Create Results DataFrame
Organize the extracted urbanization metrics into a pandas DataFrame, adding columns for distance ranges and midpoints for easier analysis.
### 8. Generate Buffer Map Image
Create a static thumbnail image from Earth Engine visualizing the defined buffer zones and rivers within the AOI, with distinct colors for each zone.
### 9. Visualize Gradient
Generate a multi-panel plot including a line plot of urbanization intensity vs. distance, a bar chart of built-up percentages per zone, a scatter plot of area vs. built-up, and the generated buffer map image.
### 10. Perform Statistical Analysis
Calculate key statistics, such as correlation between distance and built-up density, and the average gradient slope, to quantify the urbanization pattern.
### 11. Export Results
Save the detailed results DataFrame to a CSV file, and generate a comprehensive summary report as a text file in a dedicated output folder.
***
Access the complete code, step-by-step instructions, and interactive notebook in Nika Hub.
View Full Solution →