 ## Description
This analysis aims to assess the degree of urbanization within individual watersheds across a specified Area of Interest (AOI). By quantifying the percentage of built-up area within each watershed, we can classify them based on their urban impact level (e.g., Low, Moderate, High, Very High) and generate insights into human impact on these crucial hydrological units.
## Libraries Used
The script leverages several powerful Python libraries for geospatial analysis, data manipulation, and visualization:
* **ee** (Google Earth Engine Python API): Essential for accessing and processing vast amounts of satellite imagery and geospatial datasets on Google's cloud platform
* **geemap**: A Python package built on Earth Engine and Folium that simplifies Earth Engine data visualization and interaction, especially for converting Earth Engine objects to GeoPandas DataFrames
* **pandas**: A fundamental library for data manipulation and analysis, used here for working with tabular data extracted from the geospatial analysis
* **geopandas**: Extends pandas to allow spatial operations on tabular data, enabling the handling of geographic data types (like polygons for watersheds)
* **matplotlib.pyplot**: A widely used plotting library for creating static, interactive, and animated visualizations in Python
* **matplotlib.patches**: Used for creating custom shapes for plot legends
* **seaborn**: A data visualization library based on matplotlib that provides a high-level interface for drawing attractive and informative statistical graphics
* **numpy**: A core library for numerical computing, used for array operations, especially in statistical calculations
* **shapely.geometry.box**: For creating rectangular geometric objects
* **json**: For working with JSON data (though not explicitly used for direct JSON file handling in the main flow, often useful in geospatial contexts)
* **os**: For interacting with the operating system, particularly for managing file paths and creating directories
* **datetime**: For working with dates and times, used here to timestamp the analysis report
## Dataset Inputs
The analysis relies on publicly available datasets hosted on Google Earth Engine:
### HydroATLAS Basins (Level 8)
**Source**: `WWF/HydroATLAS/v1/Basins/level08`
This is a global dataset providing hierarchical hydrological basins (watersheds) at different levels of detail. Level 8 represents relatively detailed catchments. It provides the spatial boundaries of the watersheds for our analysis.
### Global Human Settlement Layer (GHSL) Built-up Surface (2020)
**Source**: `JRC/GHSL/P2023A/GHS_BUILT_S`
This dataset provides information on the presence and density of built-up areas. We specifically use the 2020 data to quantify urban extent within each watershed.
### HydroSHEDS Free Flowing Rivers
**Source**: `WWF/HydroSHEDS/v1/FreeFlowingRivers`
This dataset provides spatial information on rivers, used here primarily for contextual visualization, although not directly used in the urban impact calculation.
## Output Files
Upon successful execution, the script generates several output files in the specified `output_dir` (e.g., `watershed_urban_analysis_results`):
* **watersheds\_urban\_analysis.geojson**: A GeoJSON file containing the watershed geometries along with all calculated urban metrics and impact classifications
* **watersheds\_urban\_analysis.shp**: A Shapefile (a common geospatial vector data format) containing the same watershed data as the GeoJSON
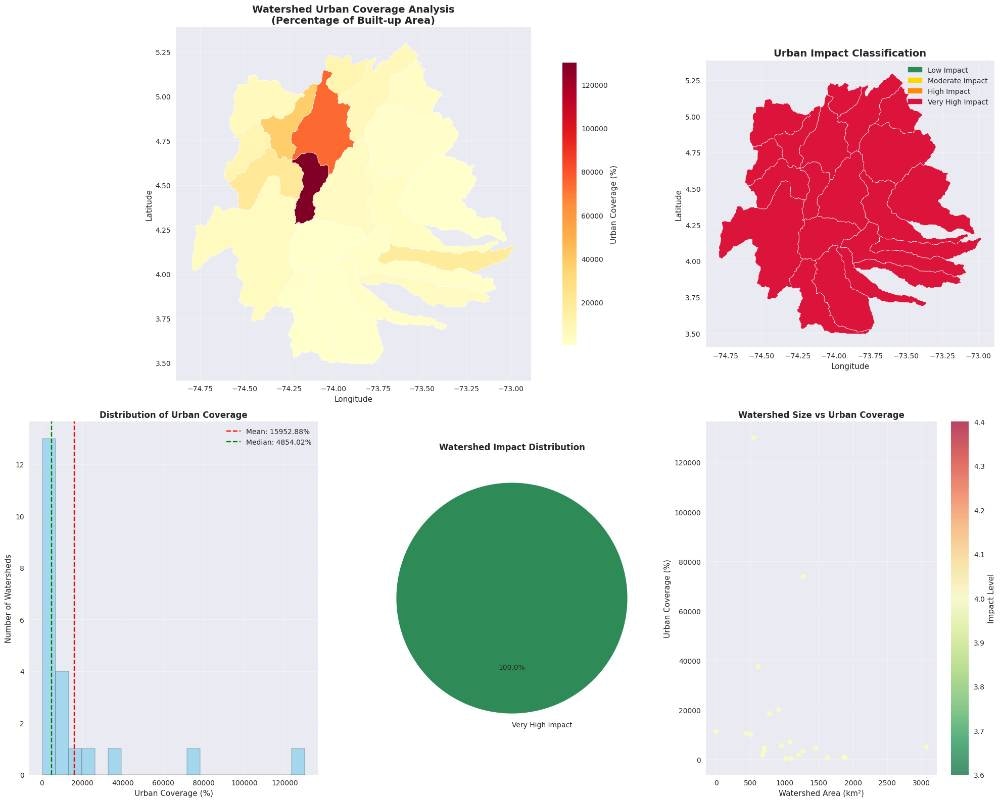
* **watershed\_urban\_analysis\_comprehensive.png**: A high-resolution PNG image presenting a multi-panel visualization, including choropleth maps, histograms, pie charts, and scatter plots of the analysis results
* **watershed\_urban\_statistics.png**: A high-resolution PNG image focusing on detailed statistical visualizations, such as box plots, cumulative distributions, and a summary table
* **analysis\_report.txt**: A plain text file summarizing key statistics, impact classifications, and analysis details
## Step-by-Step Implementation
### 3.1. Initialization and Earth Engine Setup
Import libraries, authenticate Earth Engine using service account credentials, and create output directory structure.
### 3.2. Defining the Analysis Class
Create `WatershedUrbanAnalysis` class encapsulating data loading, metric calculations, classification algorithms, download operations, visualization generation, and comprehensive reporting functionality.
### 3.3. Executing the Data Processing & Download
Instantiate analyzer object with defined AOI and execute `run_complete_analysis()` to trigger cloud-based computations and local data downloads.
### 3.4. Generating Comprehensive Visualizations
Create multi-panel visual summaries including choropleth maps, impact classifications, statistical histograms, categorical distributions, and correlation scatter plots.
### 3.5. Generating the Analysis Report
Consolidate key findings, statistical summaries, and analytical insights into structured text-based report for documentation and interpretation.
## Analysis Results & Discussion
### Summary of Findings
Present average urban coverage metrics, watershed impact category distributions, spatial pattern analysis, and correlation insights from scatter plot relationships.
### Interpretation of Impact Classes
Define impact classification thresholds and contextualize low/moderate/high impact categories within urban coverage framework.
### Limitations
Acknowledge GHSL resolution constraints, HydroBASINS delineation accuracy limitations, and impact threshold definition assumptions.
***
## Description
This analysis aims to assess the degree of urbanization within individual watersheds across a specified Area of Interest (AOI). By quantifying the percentage of built-up area within each watershed, we can classify them based on their urban impact level (e.g., Low, Moderate, High, Very High) and generate insights into human impact on these crucial hydrological units.
## Libraries Used
The script leverages several powerful Python libraries for geospatial analysis, data manipulation, and visualization:
* **ee** (Google Earth Engine Python API): Essential for accessing and processing vast amounts of satellite imagery and geospatial datasets on Google's cloud platform
* **geemap**: A Python package built on Earth Engine and Folium that simplifies Earth Engine data visualization and interaction, especially for converting Earth Engine objects to GeoPandas DataFrames
* **pandas**: A fundamental library for data manipulation and analysis, used here for working with tabular data extracted from the geospatial analysis
* **geopandas**: Extends pandas to allow spatial operations on tabular data, enabling the handling of geographic data types (like polygons for watersheds)
* **matplotlib.pyplot**: A widely used plotting library for creating static, interactive, and animated visualizations in Python
* **matplotlib.patches**: Used for creating custom shapes for plot legends
* **seaborn**: A data visualization library based on matplotlib that provides a high-level interface for drawing attractive and informative statistical graphics
* **numpy**: A core library for numerical computing, used for array operations, especially in statistical calculations
* **shapely.geometry.box**: For creating rectangular geometric objects
* **json**: For working with JSON data (though not explicitly used for direct JSON file handling in the main flow, often useful in geospatial contexts)
* **os**: For interacting with the operating system, particularly for managing file paths and creating directories
* **datetime**: For working with dates and times, used here to timestamp the analysis report
## Dataset Inputs
The analysis relies on publicly available datasets hosted on Google Earth Engine:
### HydroATLAS Basins (Level 8)
**Source**: `WWF/HydroATLAS/v1/Basins/level08`
This is a global dataset providing hierarchical hydrological basins (watersheds) at different levels of detail. Level 8 represents relatively detailed catchments. It provides the spatial boundaries of the watersheds for our analysis.
### Global Human Settlement Layer (GHSL) Built-up Surface (2020)
**Source**: `JRC/GHSL/P2023A/GHS_BUILT_S`
This dataset provides information on the presence and density of built-up areas. We specifically use the 2020 data to quantify urban extent within each watershed.
### HydroSHEDS Free Flowing Rivers
**Source**: `WWF/HydroSHEDS/v1/FreeFlowingRivers`
This dataset provides spatial information on rivers, used here primarily for contextual visualization, although not directly used in the urban impact calculation.
## Output Files
Upon successful execution, the script generates several output files in the specified `output_dir` (e.g., `watershed_urban_analysis_results`):
* **watersheds\_urban\_analysis.geojson**: A GeoJSON file containing the watershed geometries along with all calculated urban metrics and impact classifications
* **watersheds\_urban\_analysis.shp**: A Shapefile (a common geospatial vector data format) containing the same watershed data as the GeoJSON
* **watershed\_urban\_analysis\_comprehensive.png**: A high-resolution PNG image presenting a multi-panel visualization, including choropleth maps, histograms, pie charts, and scatter plots of the analysis results
* **watershed\_urban\_statistics.png**: A high-resolution PNG image focusing on detailed statistical visualizations, such as box plots, cumulative distributions, and a summary table
* **analysis\_report.txt**: A plain text file summarizing key statistics, impact classifications, and analysis details
## Step-by-Step Implementation
### 3.1. Initialization and Earth Engine Setup
Import libraries, authenticate Earth Engine using service account credentials, and create output directory structure.
### 3.2. Defining the Analysis Class
Create `WatershedUrbanAnalysis` class encapsulating data loading, metric calculations, classification algorithms, download operations, visualization generation, and comprehensive reporting functionality.
### 3.3. Executing the Data Processing & Download
Instantiate analyzer object with defined AOI and execute `run_complete_analysis()` to trigger cloud-based computations and local data downloads.
### 3.4. Generating Comprehensive Visualizations
Create multi-panel visual summaries including choropleth maps, impact classifications, statistical histograms, categorical distributions, and correlation scatter plots.
### 3.5. Generating the Analysis Report
Consolidate key findings, statistical summaries, and analytical insights into structured text-based report for documentation and interpretation.
## Analysis Results & Discussion
### Summary of Findings
Present average urban coverage metrics, watershed impact category distributions, spatial pattern analysis, and correlation insights from scatter plot relationships.
### Interpretation of Impact Classes
Define impact classification thresholds and contextualize low/moderate/high impact categories within urban coverage framework.
### Limitations
Acknowledge GHSL resolution constraints, HydroBASINS delineation accuracy limitations, and impact threshold definition assumptions.
***
Access the complete code, step-by-step instructions, and interactive notebook in Nika Hub.
View Full Solution →