> ## Documentation Index
> Fetch the complete documentation index at: https://docs.nikaplanet.com/llms.txt
> Use this file to discover all available pages before exploring further.
# Visualizations & Artifacts
> The interactive maps, charts, dashboards, 3D viewers, surveys, and shareable reports NIKA generates live in the conversation.
## Answers You Can See and Share
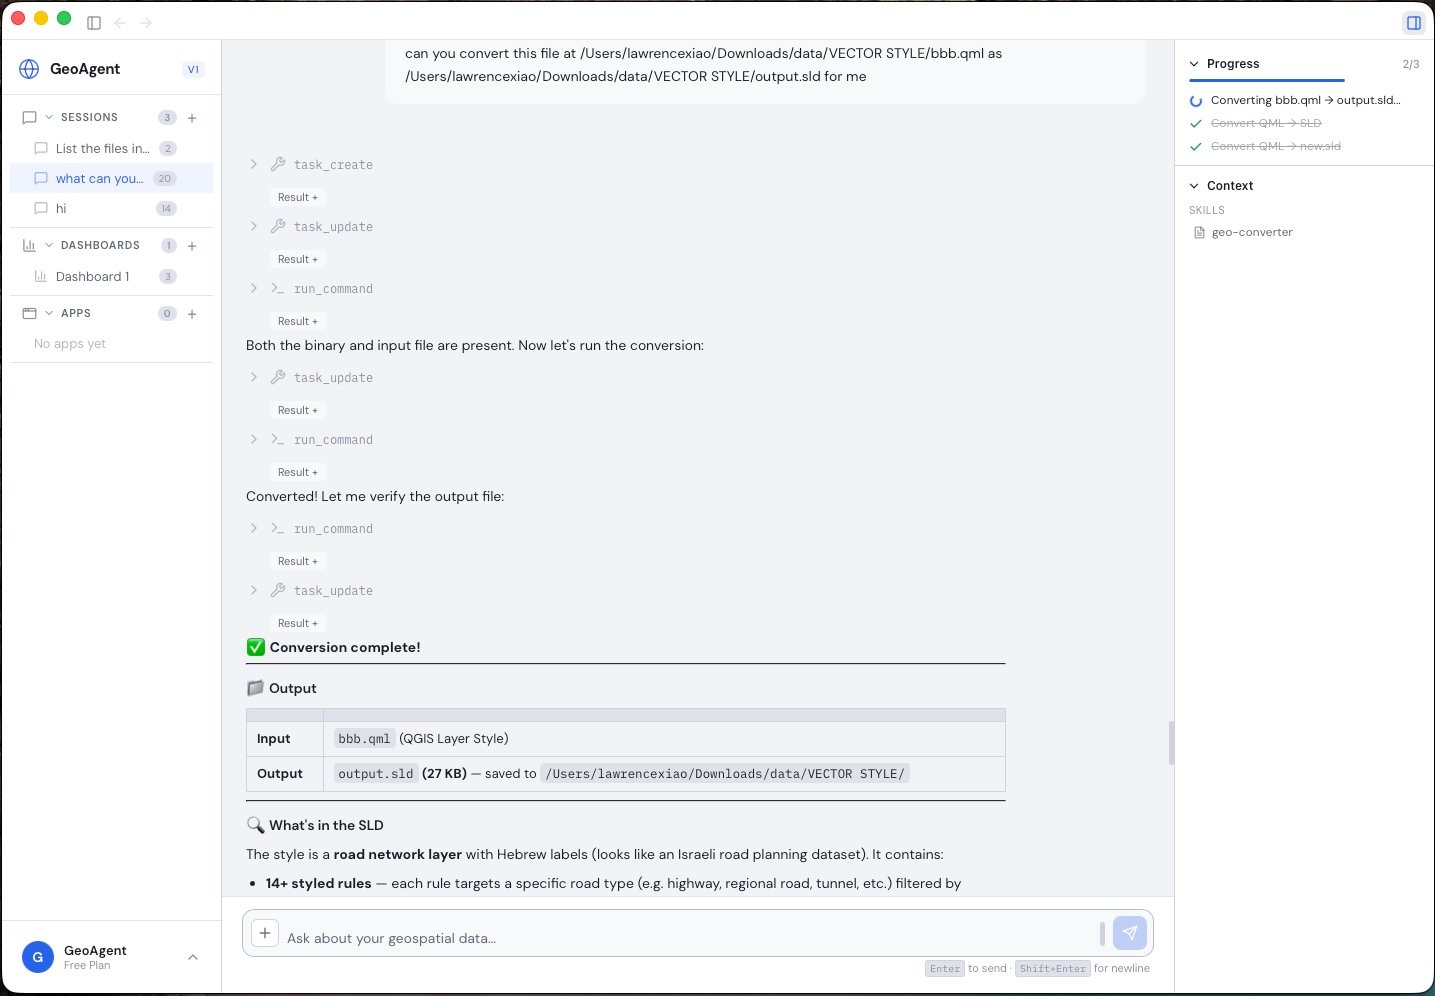
NIKA doesn't just describe results — it builds them. As the agent works, it generates rich, interactive artifacts directly in the conversation, so the output of an analysis is something you can explore, present, and hand to a decision-maker, not a wall of text.
 ## What NIKA Can Generate
Maps with raster, vector, and GeoJSON layer management — pan, zoom, toggle layers, and inspect features right in the conversation.
The agent generates interactive chart specifications from your data, so trends and comparisons are visible at a glance.
Compose multiple charts and views into a drag-and-drop dashboard canvas for a single, scannable overview.
Visualize 3D scans, point clouds, and terrain models without exporting to a separate tool.
Design and preview field survey forms directly in the agent, ready to push out to field teams.
Generate and preview self-contained web applications built around your data and analysis.
Automatic diagram rendering for architecture, flowcharts, and workflows when you need to explain a process.
Package the analysis and its artifacts into a shareable report you can hand to stakeholders.
## From Analysis to Artifact
Every visualization is the end of an [autonomous analysis](/nika-desktop/autonomous-analysis): you ask in plain language, NIKA runs the work across your [connected data](/nika-desktop/data-and-conversion), and the result arrives as an artifact you can explore and share — no handoff to a separate GIS or BI tool required.
## What NIKA Can Generate
Maps with raster, vector, and GeoJSON layer management — pan, zoom, toggle layers, and inspect features right in the conversation.
The agent generates interactive chart specifications from your data, so trends and comparisons are visible at a glance.
Compose multiple charts and views into a drag-and-drop dashboard canvas for a single, scannable overview.
Visualize 3D scans, point clouds, and terrain models without exporting to a separate tool.
Design and preview field survey forms directly in the agent, ready to push out to field teams.
Generate and preview self-contained web applications built around your data and analysis.
Automatic diagram rendering for architecture, flowcharts, and workflows when you need to explain a process.
Package the analysis and its artifacts into a shareable report you can hand to stakeholders.
## From Analysis to Artifact
Every visualization is the end of an [autonomous analysis](/nika-desktop/autonomous-analysis): you ask in plain language, NIKA runs the work across your [connected data](/nika-desktop/data-and-conversion), and the result arrives as an artifact you can explore and share — no handoff to a separate GIS or BI tool required.