> ## Documentation Index
> Fetch the complete documentation index at: https://docs.nikaplanet.com/llms.txt
> Use this file to discover all available pages before exploring further.
# NikaStudio
> AI-powered dashboard and visualization builder for data scientists and engineers to illustrate their research outcomes
## Overview
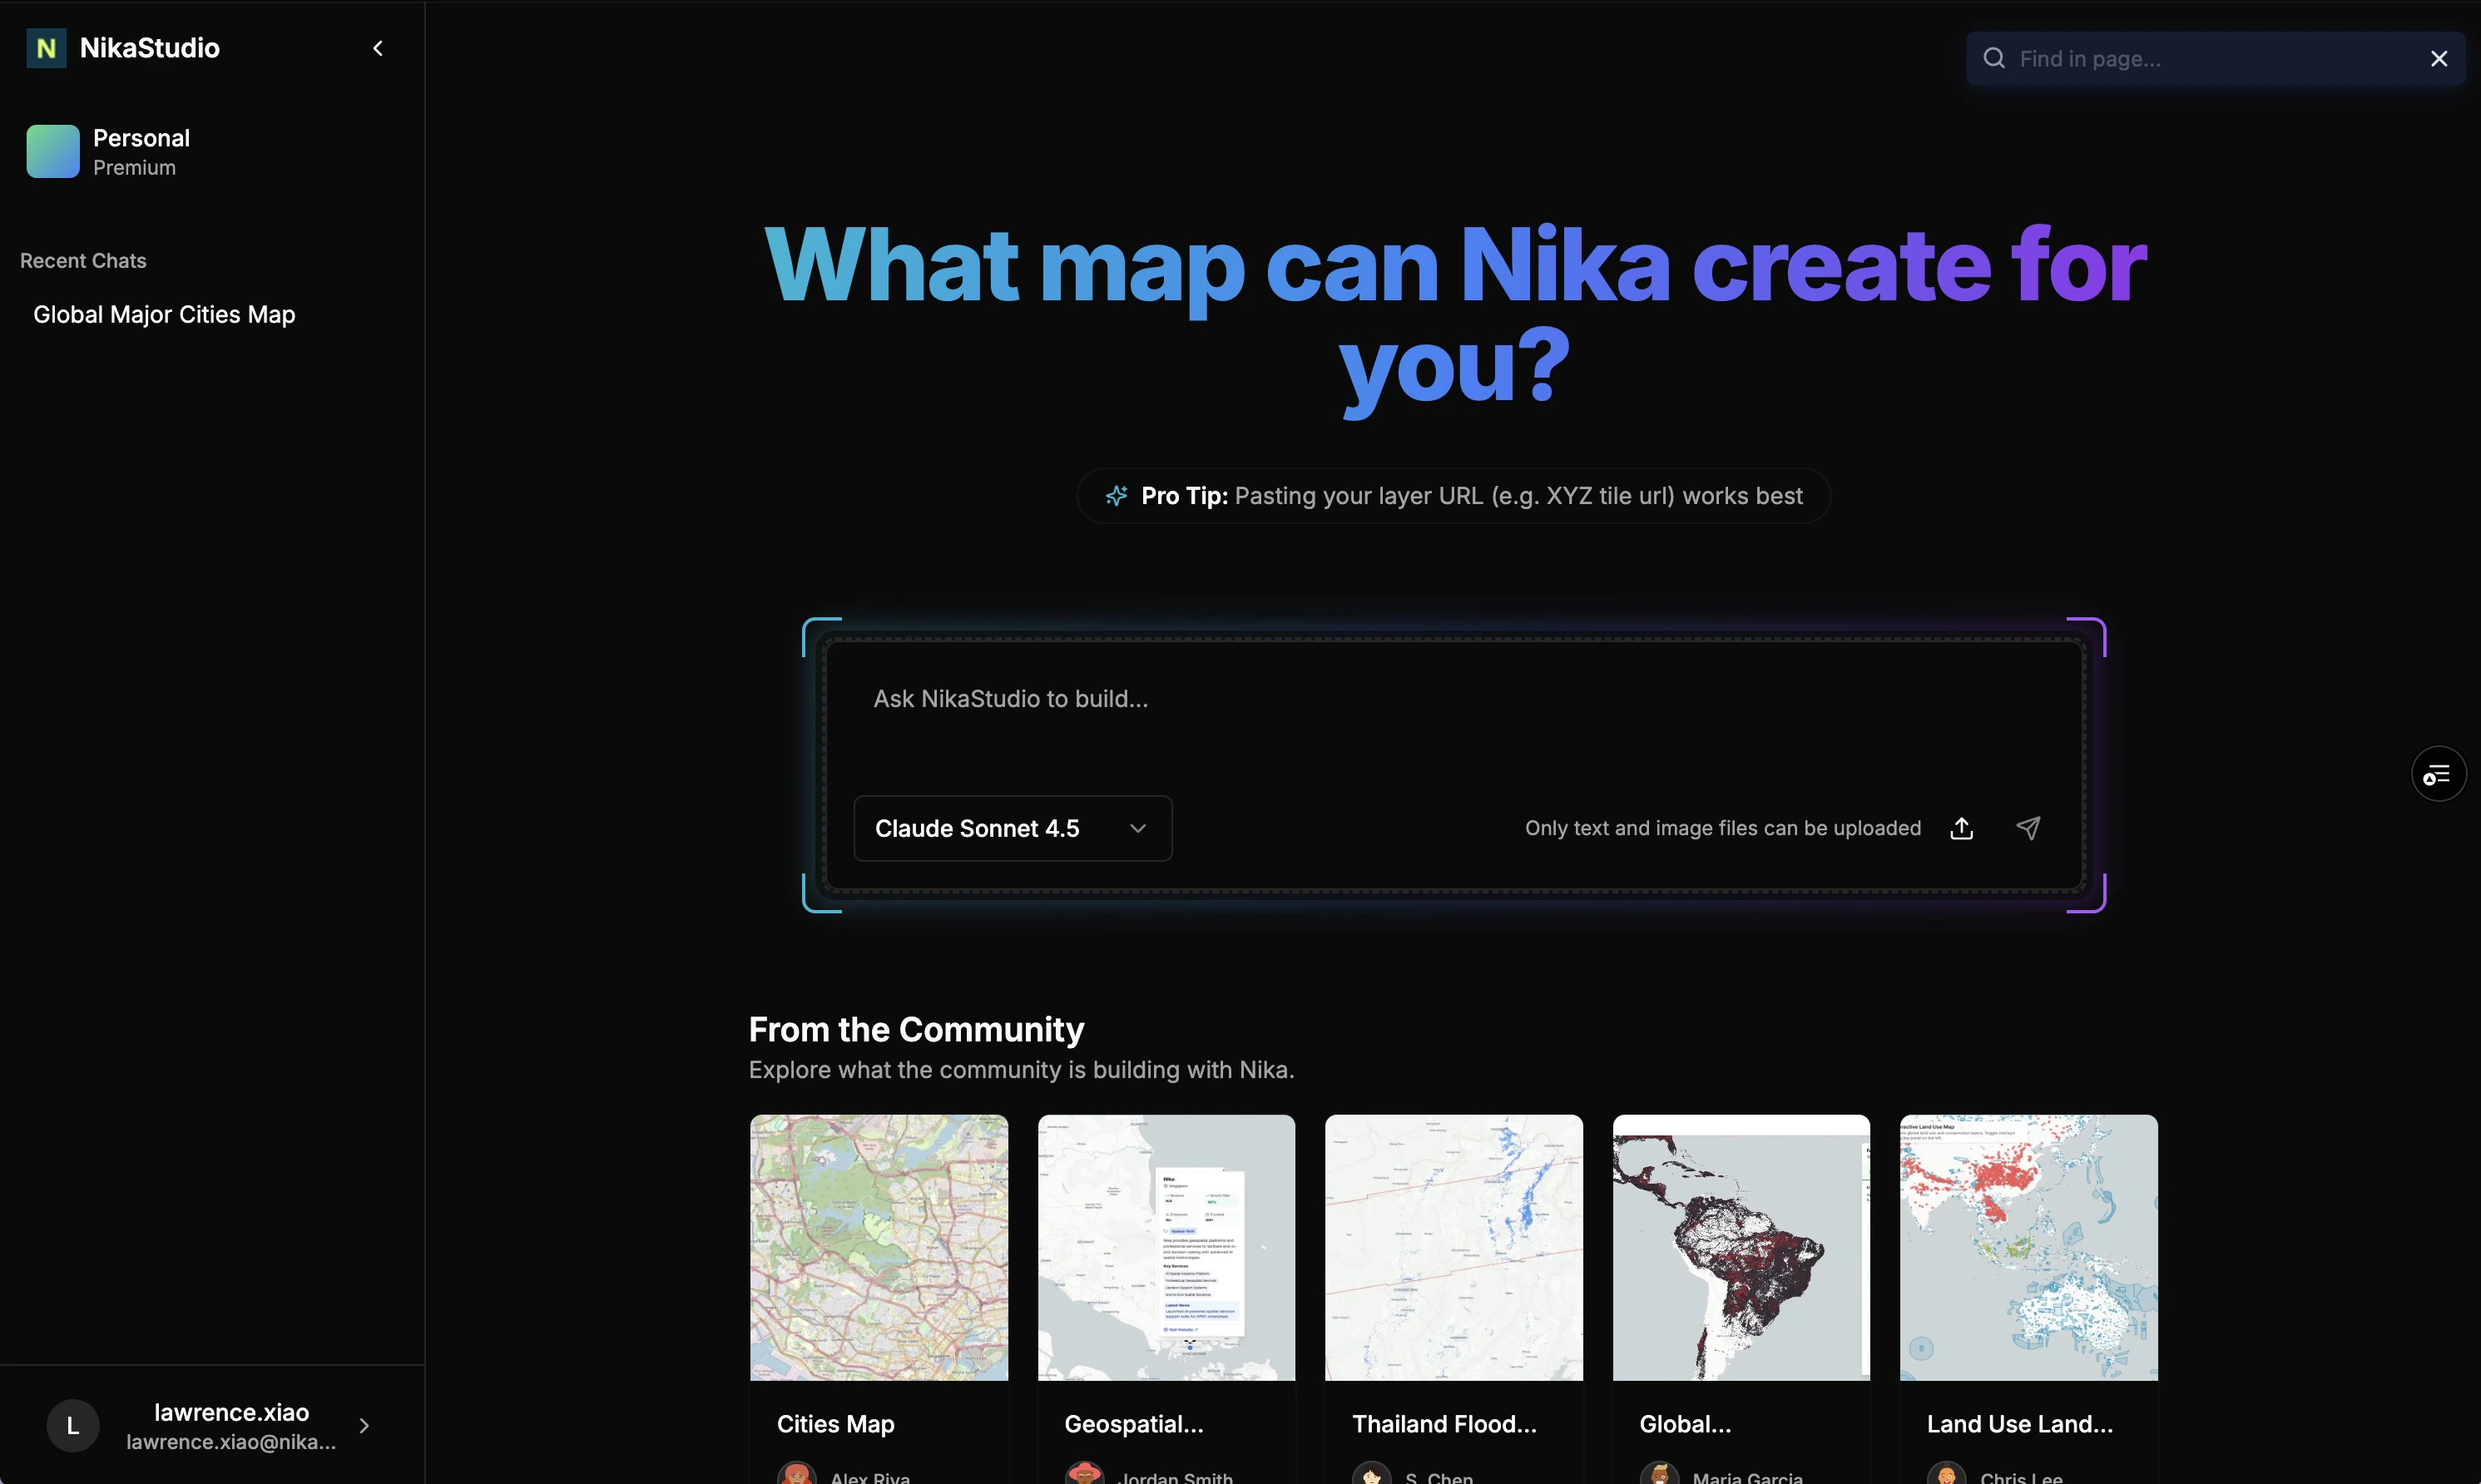
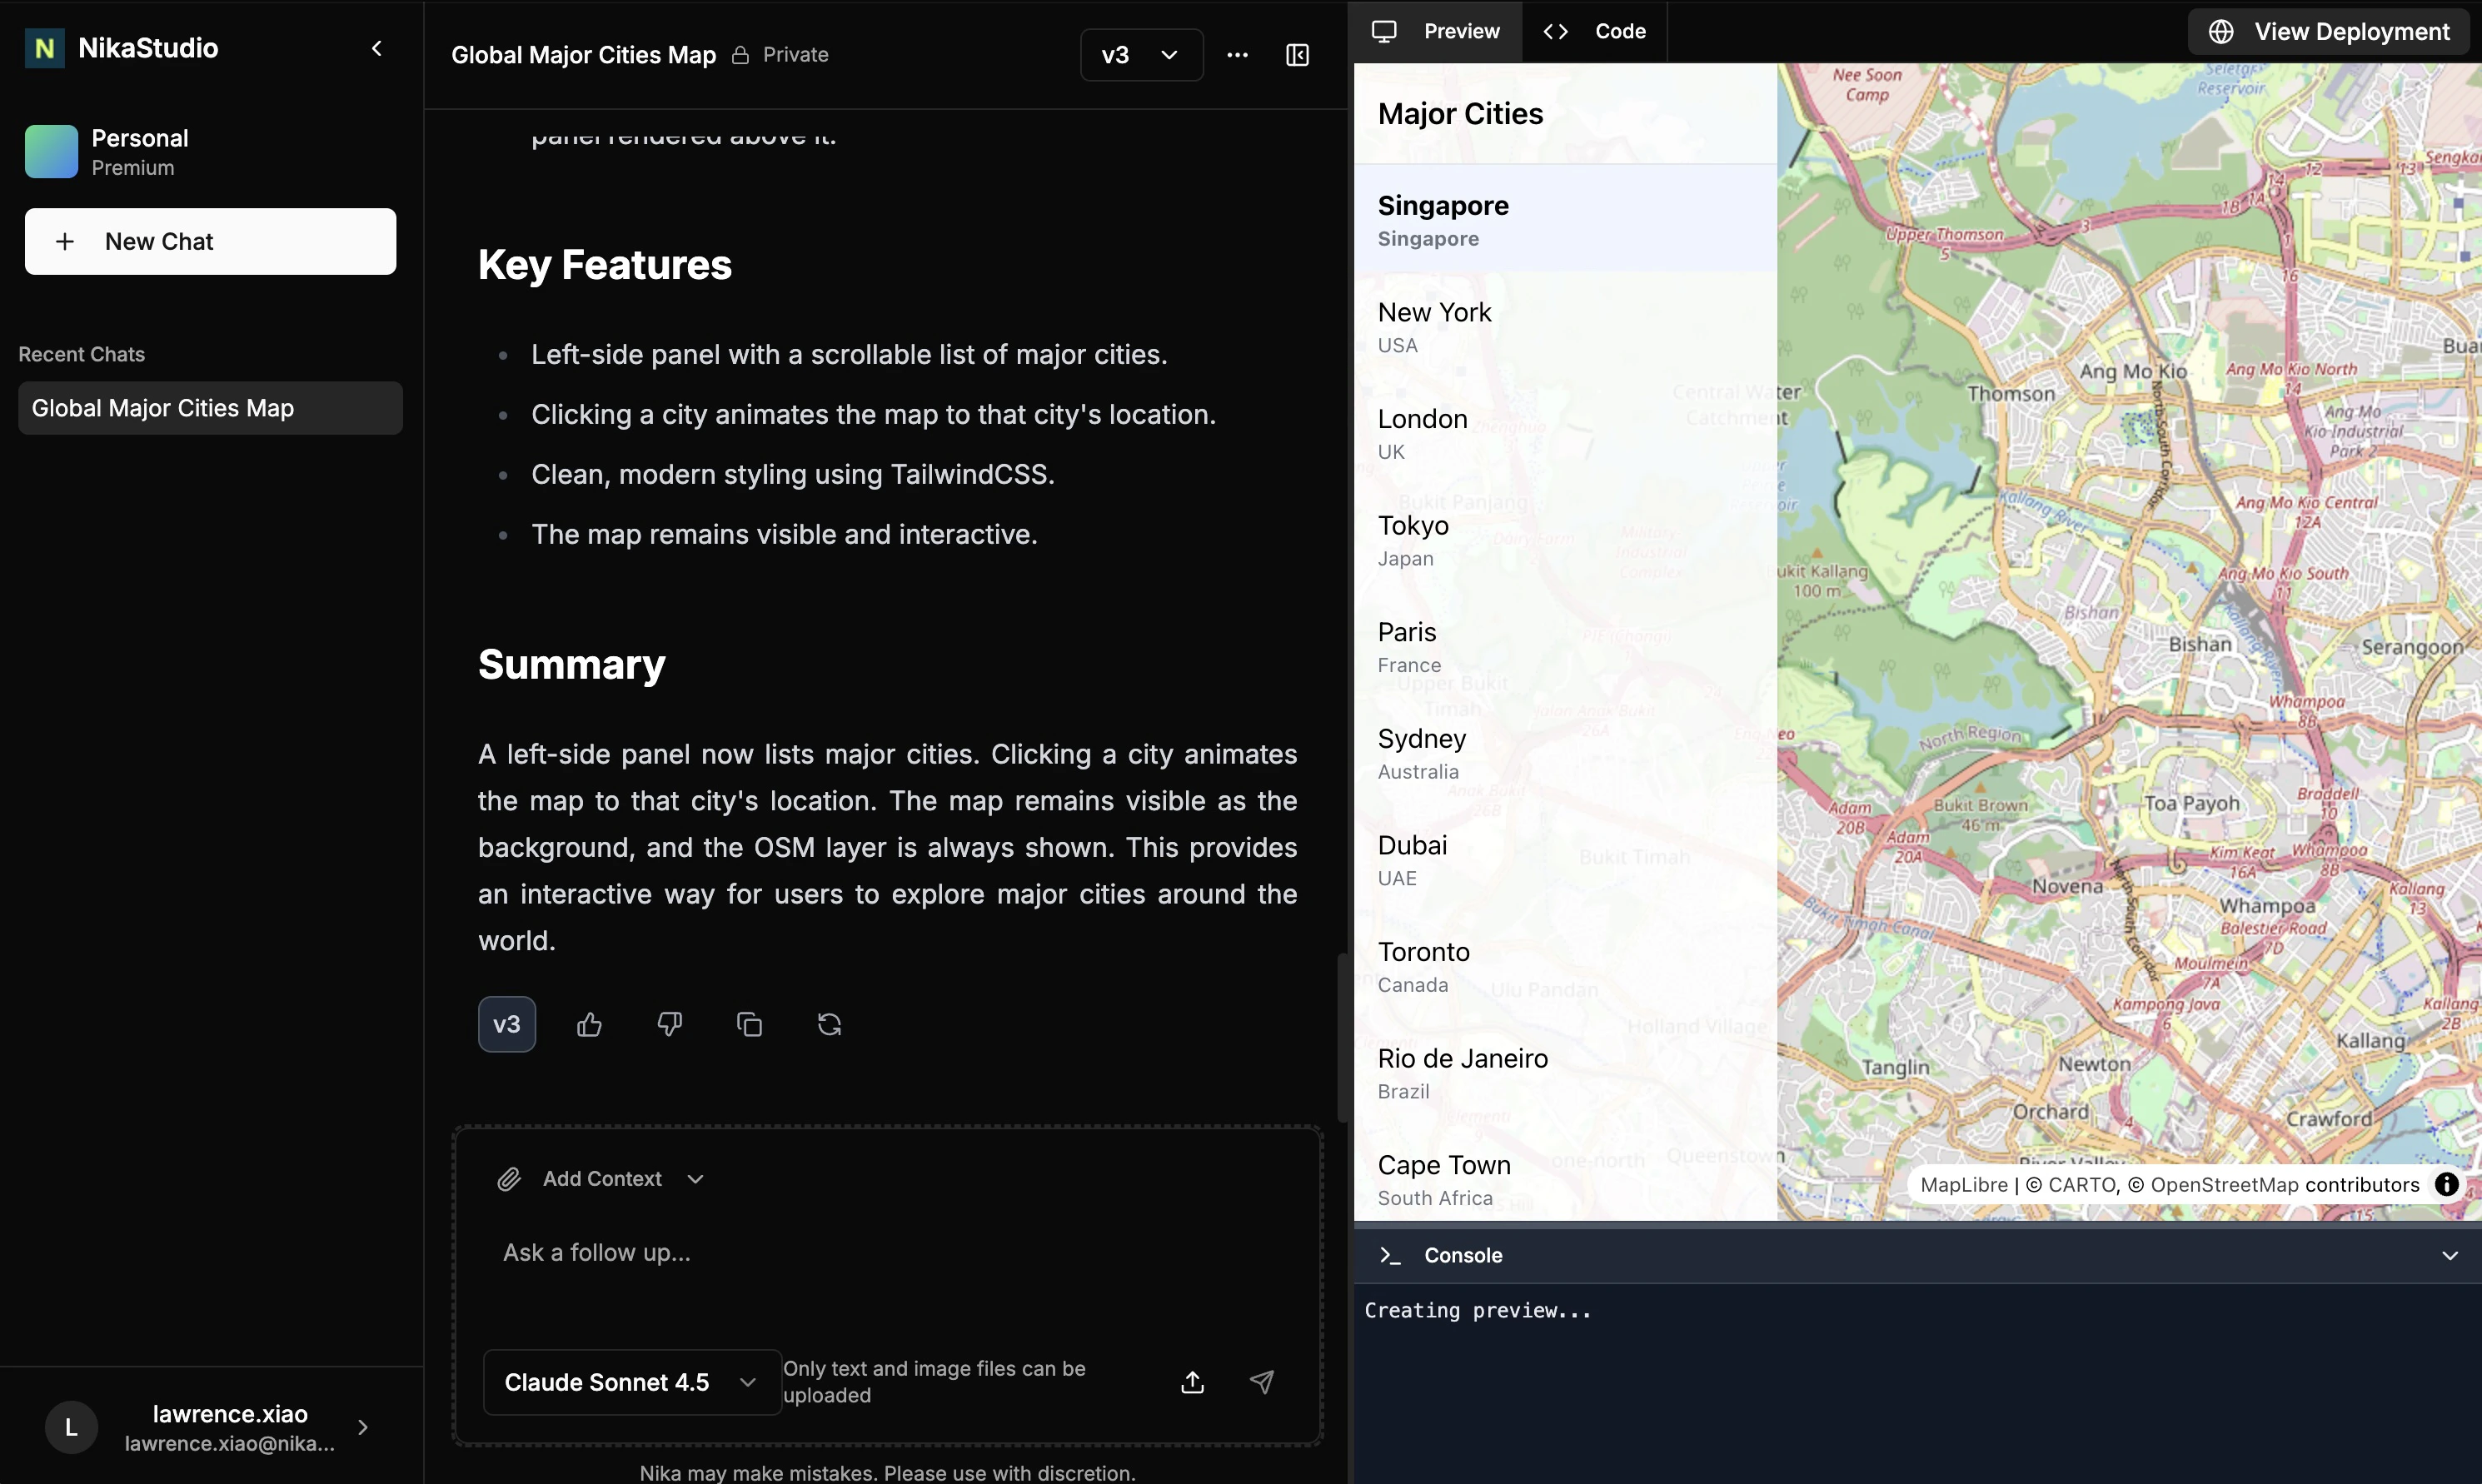
NikaStudio is an AI-powered map dashboard builder designed specifically for data scientists and data engineers who need to illustrate their work outcomes. When you finish your scientific research (remote sensing based or not), NikaStudio helps you create interactive dashboards and visualizations to communicate your findings effectively to managers, stakeholders, or the broader community.
 ### Flexible Prototyping Tool
After completing scientific research, data scientists and engineers often struggle to effectively communicate their findings. Traditional presentation methods fall short when you need to show:
* Moving buoy data that drifts around on a map
* Interactive visualizations that let stakeholders explore the data
* Custom dashboards that illustrate complex scientific concepts
* Dynamic interfaces that adapt to different research requirements
## Key Features
### AI-Powered Dashboard Generation
* **Natural Language Interface**: Describe your visualization needs in plain English
* **Custom UI Generation**: AI creates tailored interfaces for your specific research requirements
* **Flexible Design**: Unlike rigid drag-and-drop builders, AI adapts to your unique visualization needs
* **Code Quality Control**: Built-in linting and UI consistency checks to minimize AI hallucinations
### Geospatial Data Backend (WIP)
* **Data Hosting Service**: Built-in support for most geospatial formats
* **ETL Integration**: Seamless data conversion through NikaFlow
* **Easy Data Access**: AI can work with your data without complex parsing steps
* **Real-time Visualization**: Live data updates for dynamic research presentations
## Community Examples
### Real Applications Built with NikaStudio
Explore these live examples at [https://planet.nika.eco/en/hub/apps](https://planet.nika.eco/en/hub/apps):
* **Global Deforestation**: Interactive visualization of deforestation patterns worldwide
* **Land Use GFW**: Global Forest Watch land use change analysis dashboard
* **Global Geospatial Companies**: Map of geospatial companies and their locations
* **Earthquake Map**: Real-time earthquake data visualization and analysis
* **COG Overlay Example**: Cloud Optimized GeoTIFF overlay demonstration
* **Thailand Flood Map**: Flood risk and impact visualization for Thailand
## How Our AI Reduces Hallucination
### Focused AI Capabilities
Rather than having AI handle everything, we focus AI on what it does best - UI/UX generation - while handling data parsing and hosting through dedicated services:
* **Data Hosting Service**: Pre-processed geospatial data in formats AI can easily work with (to be built)
* **Code Quality Control**: Built-in linting on each code generation step
* **UI Consistency Checks**: Reinforcement loops to maintain design consistency
### Flexible Prototyping Tool
After completing scientific research, data scientists and engineers often struggle to effectively communicate their findings. Traditional presentation methods fall short when you need to show:
* Moving buoy data that drifts around on a map
* Interactive visualizations that let stakeholders explore the data
* Custom dashboards that illustrate complex scientific concepts
* Dynamic interfaces that adapt to different research requirements
## Key Features
### AI-Powered Dashboard Generation
* **Natural Language Interface**: Describe your visualization needs in plain English
* **Custom UI Generation**: AI creates tailored interfaces for your specific research requirements
* **Flexible Design**: Unlike rigid drag-and-drop builders, AI adapts to your unique visualization needs
* **Code Quality Control**: Built-in linting and UI consistency checks to minimize AI hallucinations
### Geospatial Data Backend (WIP)
* **Data Hosting Service**: Built-in support for most geospatial formats
* **ETL Integration**: Seamless data conversion through NikaFlow
* **Easy Data Access**: AI can work with your data without complex parsing steps
* **Real-time Visualization**: Live data updates for dynamic research presentations
## Community Examples
### Real Applications Built with NikaStudio
Explore these live examples at [https://planet.nika.eco/en/hub/apps](https://planet.nika.eco/en/hub/apps):
* **Global Deforestation**: Interactive visualization of deforestation patterns worldwide
* **Land Use GFW**: Global Forest Watch land use change analysis dashboard
* **Global Geospatial Companies**: Map of geospatial companies and their locations
* **Earthquake Map**: Real-time earthquake data visualization and analysis
* **COG Overlay Example**: Cloud Optimized GeoTIFF overlay demonstration
* **Thailand Flood Map**: Flood risk and impact visualization for Thailand
## How Our AI Reduces Hallucination
### Focused AI Capabilities
Rather than having AI handle everything, we focus AI on what it does best - UI/UX generation - while handling data parsing and hosting through dedicated services:
* **Data Hosting Service**: Pre-processed geospatial data in formats AI can easily work with (to be built)
* **Code Quality Control**: Built-in linting on each code generation step
* **UI Consistency Checks**: Reinforcement loops to maintain design consistency