River Ecology Stress Hotspot
Hotspot Detection
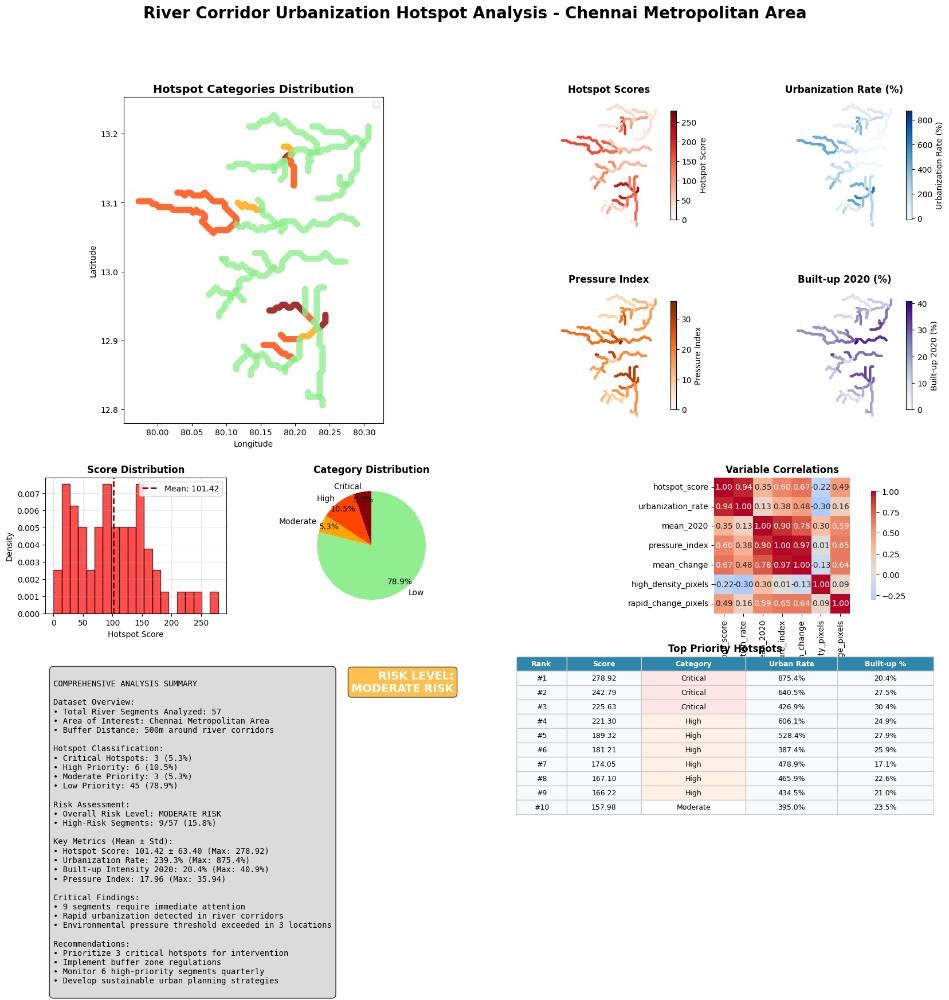
Identify river segments with highest urban development pressure. Measure the rapid urbanization areas along the river corridor and highlight the region where the most massive urbanization has happened.Description
This project analyzes urbanization hotspot trends within river corridors of the Chennai Metropolitan Area between 1990 and 2020 using Google Earth Engine and the Global Human Settlement Layer (GHSL) data. It provides comprehensive spatial and statistical insights into built-up area changes, assessing environmental risks and projecting future trends.Resources Needed
Google Earth Engine (GEE) Account
Access to the GEE platform is essential for data processing and analysis.GEE Service Account Credentials
A service account email and a corresponding JSON key file are required for programmatic authentication to GEE.Python Environment
A Python installation (3.8 or higher recommended) with the following libraries:- ee - Google Earth Engine Python API
- geemap - Interactive mapping with Google Earth Engine
- rasterio - Geospatial raster data I/O
- geopandas - Geospatial data manipulation and analysis
- numpy - Numerical computing
- pandas - Data manipulation and analysis
- matplotlib - Plotting and visualization
- seaborn - Statistical data visualization
- scipy - Scientific computing
- scikit-learn - Machine learning algorithms
- shapely - Geometric operations
Output
The script will produce the following outputs in a newly created directory named[analysis_output_directory]:
GeoJSON Files
- [primary_features].geojson: Vector file representing the main geographic features or analysis zones
- [analysis_regions].geojson: Vector file containing processed spatial analysis regions
GeoTIFF Files
- [baseline_data].tif: Raster image of baseline conditions for the specified time period
- [current_data].tif: Raster image of current conditions for comparison analysis
- [change_analysis].tif: Raster image showing change patterns between time periods
- [derived_metrics].tif: Raster image of calculated indices or composite metrics
- [classification_results].tif: Raster image showing classified categories or zones
PNG Image Files
- [comprehensive_analysis].png: Multi-panel figure summarizing the analysis with spatial maps, statistical plots, and key findings
- [detailed_analysis].png: In-depth visualization showing specific patterns, trends, and additional statistical breakdowns
CSV Files
- [analysis_summary].csv: Tabular summary of key statistical metrics and results
- [detailed_statistics].csv: Comprehensive statistical output with segment-wise or zone-wise metrics
Console Output
Detailed progress messages, processing status, statistical summaries, and final analysis results.Methodology and High-Level Steps
1. Earth Engine Initialization
Authenticate Google Earth Engine API using service account credentials and configure cloud computing environment.2. Configuration Setup
Define Area of Interest (AOI), establish output directory structure, and set analysis parameters including thresholds and buffer distances.3. Data Processing (Google Earth Engine)
Load datasets from Earth Engine catalog, apply spatial/temporal filters, perform geometric operations, process raster imagery, calculate change metrics, and export GeoJSON/GeoTIFF files.4. Local Data Integration
Load exported GeoJSON files into GeoPandas and GeoTIFF files using rasterio, then validate data integrity.5. Statistical Analysis
Mask NoData values, calculate comprehensive statistics, perform zone-wise analysis, compute derived metrics, and apply statistical validation procedures.6. Classification and Ranking
Develop scoring algorithms, apply threshold-based classification, rank features by calculated metrics, and perform spatial clustering analysis.7. Comprehensive Visualization
Generate multi-panel matplotlib figures with spatial maps, statistical plots, comparative visualizations, and apply appropriate styling for clarity.8. Results Compilation and Export
Compile analytical results into structured formats, generate CSV files and comprehensive reports, and organize outputs with clear naming conventions.9. Quality Assurance and Validation
Implement error handling, perform validation checks, document processing steps, and generate processing logs for reproducibility.🚀 Ready to implement this solution?
Access the complete code, step-by-step instructions, and interactive notebook in Nika Hub.
View Full Solution →