River Urbanisation With Major Cities Comparisons
River Basin Urban Development Analyzer
Processes satellite imagery (built-up, water, NDVI) to analyze urban development patterns across multiple regions, generating statistical summaries, comparison plots, and detailed land use classifications.Requirements
Input Data
TIF files for each region:*_buildup.tif, *_water.tif, *_ndvi.tif, *_satellite.tif
Files Created
High-Level Workflow Steps
1. Region Discovery & Data Loading
Auto-discover regions from*_buildup.tif files in data directory
Load corresponding water, NDVI, and satellite imagery for each region
Handle nodata values and coordinate transformations
2. Statistical Analysis
Calculate built-up area coverage and intensity (hectares & percentages) Analyze water occurrence (permanent vs seasonal water bodies) Compute vegetation indices (NDVI-based green cover analysis) Generate composite land use statistics3. Urban Classification
- Dense Urban: >50% built-up coverage
- Moderate Urban: 25-50% built-up coverage
- Low Urban: 10-25% built-up coverage
- Rural/Natural: <10% built-up coverage
4. Visualization Generation
Comparison Plots: 4-panel matplotlib figure with scatter plots, bar charts, and pie charts Regional Details: Individual 4-panel analysis showing built-up, water, NDVI, and land use classification Static PNG Output: High-resolution images suitable for reports and publications5. Report Generation
Regional rankings (most urbanized, highest water coverage, most vegetated) Key insights and development patterns Comprehensive data tables with all calculated metricsOutput Analysis Capabilities
This script generates comprehensive urban development assessment using:- Built-up Intensity Maps - Identifies urban development patterns and density
- Water Occurrence Analysis - Distinguishes permanent vs seasonal water bodies
- Vegetation Health (NDVI) - Maps green cover and vegetation density
- Land Use Classification - Composite analysis of urban, water, vegetation, and other land uses
Visualization Outputs
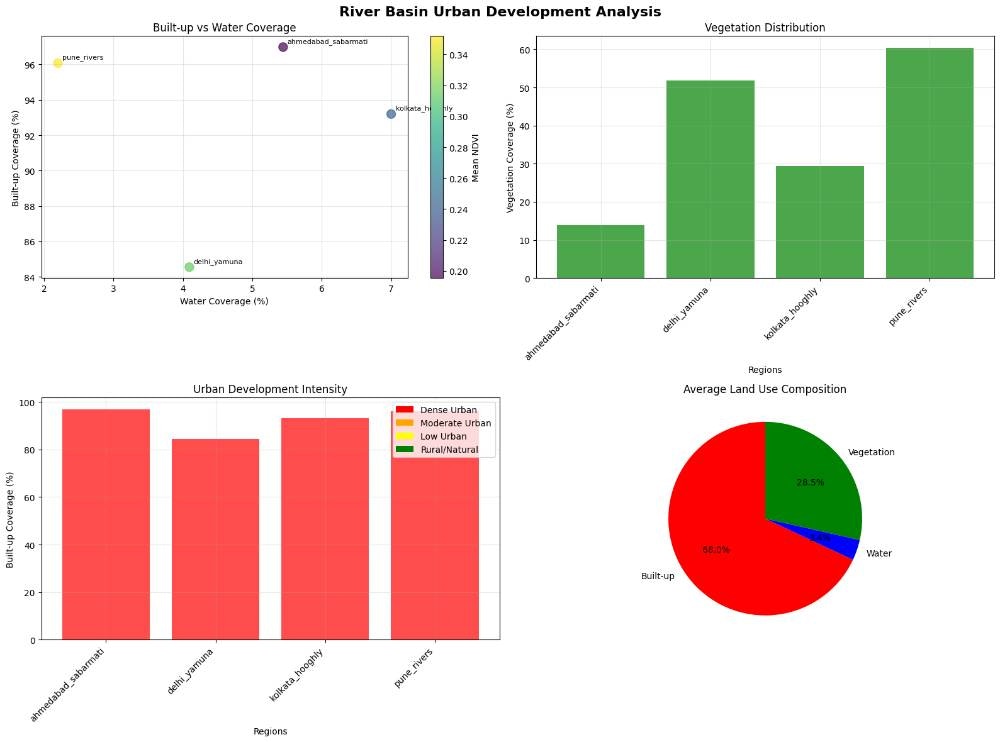
Comparison Analysis (4-Panel Plot)
- Built-up vs Water Coverage Scatter - Shows relationship between urbanization and water presence (colored by NDVI)
- Vegetation Distribution Bar Chart - Compares green cover across all regions
- Urban Development Intensity - Color-coded by urban classification (Dense/Moderate/Low/Rural)
- Average Land Use Pie Chart - Overall composition of built-up, water, vegetation, and other land uses
Detailed Regional Analysis (Per Region)
- Built-up Areas Map - Red intensity showing urban development density
- Water Occurrence Map - Blue gradient showing water body frequency (0-100%)
- Vegetation Index (NDVI) - Green-red gradient showing vegetation health (-0.2 to 0.8)
- Land Use Classification - Categorical map (Urban=Red, Water=Blue, Vegetation=Green, Other=Black)
Key Metrics Calculated
Analysis Insights Generated
- Urban Pressure Assessment - Identifies regions with high development pressure
- Water Resource Mapping - Quantifies permanent vs seasonal water availability
- Green Space Evaluation - Measures vegetation cover and ecological health
- Development Patterns - Reveals relationships between urbanization and environmental factors
Result
Multi-scale urban development analysis with both regional comparisons and detailed local assessments for sustainable planning and environmental monitoring.Output
Quick Summary
🚀 Ready to implement this solution?
Access the complete code, step-by-step instructions, and interactive notebook in Nika Hub.
View Full Solution →