Urban Construction Near Riparian Areas
Riparian Zone Urbanization Gradients
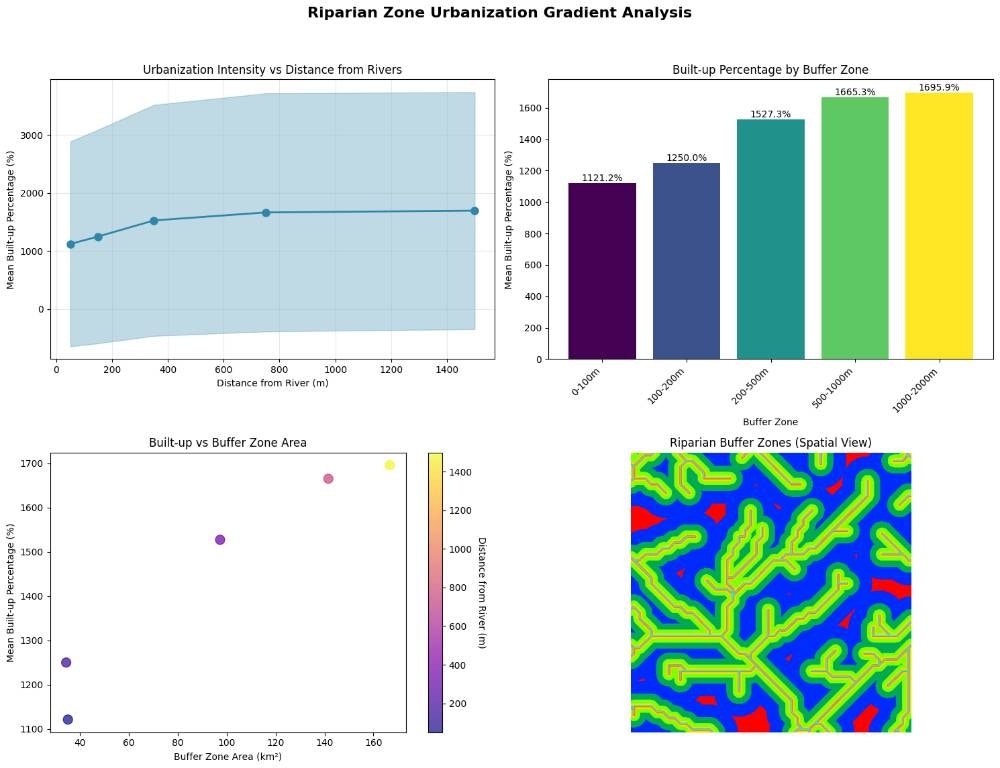
This project performs an analysis of riparian zone urbanization gradients near the Amazon River, specifically focusing on a defined area near Manaus. It quantifies how built-up surface density changes with increasing distance from river systems, providing insights into human impact on riparian ecosystems.Resources Needed
Software
- Python 3.x
Libraries
- earthengine-api: For interacting with Google Earth Engine
- pandas: For data manipulation and analysis
- matplotlib: For creating static, interactive, and animated visualizations in Python
- numpy: For numerical operations
- seaborn: For statistical data visualization
- Pillow (PIL): For image processing
- requests: For making HTTP requests (e.g., downloading images)
Google Earth Engine Account
An active Google Earth Engine account is required to access the spatial datasets.Internet Connection
Essential for accessing Earth Engine data and services.Input Files
This project does not require explicit input files from your local machine. All necessary spatial data is accessed directly from the Google Earth Engine data catalog:- WWF/HydroSHEDS/v1/FreeFlowingRivers: Global dataset of free-flowing rivers
- JRC/GHSL/P2023A/GHS_BUILT_S: Global Human Settlement Layer (GHSL) Built-up Surface dataset for 2020
- FAO/GAUL/2015/level2 (Optional): Administrative boundaries used if the AOI is defined by an administrative name (not used in the provided code’s default AOI)
Output Files
The project generates output files within a newly created output folder:- riparian_amazon_analysis_YYYYMMDD_HHMMSS.png: A high-resolution PNG image of the generated plots, visualizing the urbanization gradient and the spatial distribution of buffer zones
- riparian_amazon_results_YYYYMMDD_HHMMSS.csv: A CSV file containing the detailed urbanization metrics for each riparian buffer zone, including area, mean built-up percentage, and standard deviation
- riparian_amazon_summary_YYYYMMDD_HHMMSS.txt: A text file providing a summary report of the analysis, including key statistics, correlations, and a breakdown of built-up percentages per zone
Step-by-Step Analysis
1. Initialize Earth Engine
Authenticate and initialize the Google Earth Engine API to enable data access.2. Define Area of Interest (AOI)
Specify the geographical region for the analysis, in this case, a rectangle near Manaus, Amazon River.3. Load Datasets
Import the HydroRIVERS dataset for river networks and the GHSL Built-up Surface dataset for urbanization data from Earth Engine.4. Filter Rivers
Clip and filter the global HydroRIVERS dataset to retain only the river segments within the defined AOI.5. Create Buffer Zones
Generate non-overlapping buffer rings around the filtered river segments at specified distances (e.g., 0-100m, 100-200m, etc.).6. Extract Urbanization Metrics
For each buffer zone, calculate descriptive statistics (mean, standard deviation, min, max, pixel count) of the built-up surface percentage using the GHSL data.7. Create Results DataFrame
Organize the extracted urbanization metrics into a pandas DataFrame, adding columns for distance ranges and midpoints for easier analysis.8. Generate Buffer Map Image
Create a static thumbnail image from Earth Engine visualizing the defined buffer zones and rivers within the AOI, with distinct colors for each zone.9. Visualize Gradient
Generate a multi-panel plot including a line plot of urbanization intensity vs. distance, a bar chart of built-up percentages per zone, a scatter plot of area vs. built-up, and the generated buffer map image.10. Perform Statistical Analysis
Calculate key statistics, such as correlation between distance and built-up density, and the average gradient slope, to quantify the urbanization pattern.11. Export Results
Save the detailed results DataFrame to a CSV file, and generate a comprehensive summary report as a text file in a dedicated output folder.🚀 Ready to implement this solution?
Access the complete code, step-by-step instructions, and interactive notebook in Nika Hub.
View Full Solution →