

This product is currently in limited preview. Features and functionality may change drastically. If you are interested in this feature, you may talk to us at sales@nikaplanet.com.
Overview
NikaDashboard is a powerful real-time analytics dashboard builder designed specifically for geospatial data visualization and business intelligence. Built for teams and organizations that need to create interactive dashboards with live data feeds, NikaDashboard provides an intuitive drag-and-drop interface for building custom analytics dashboards without coding.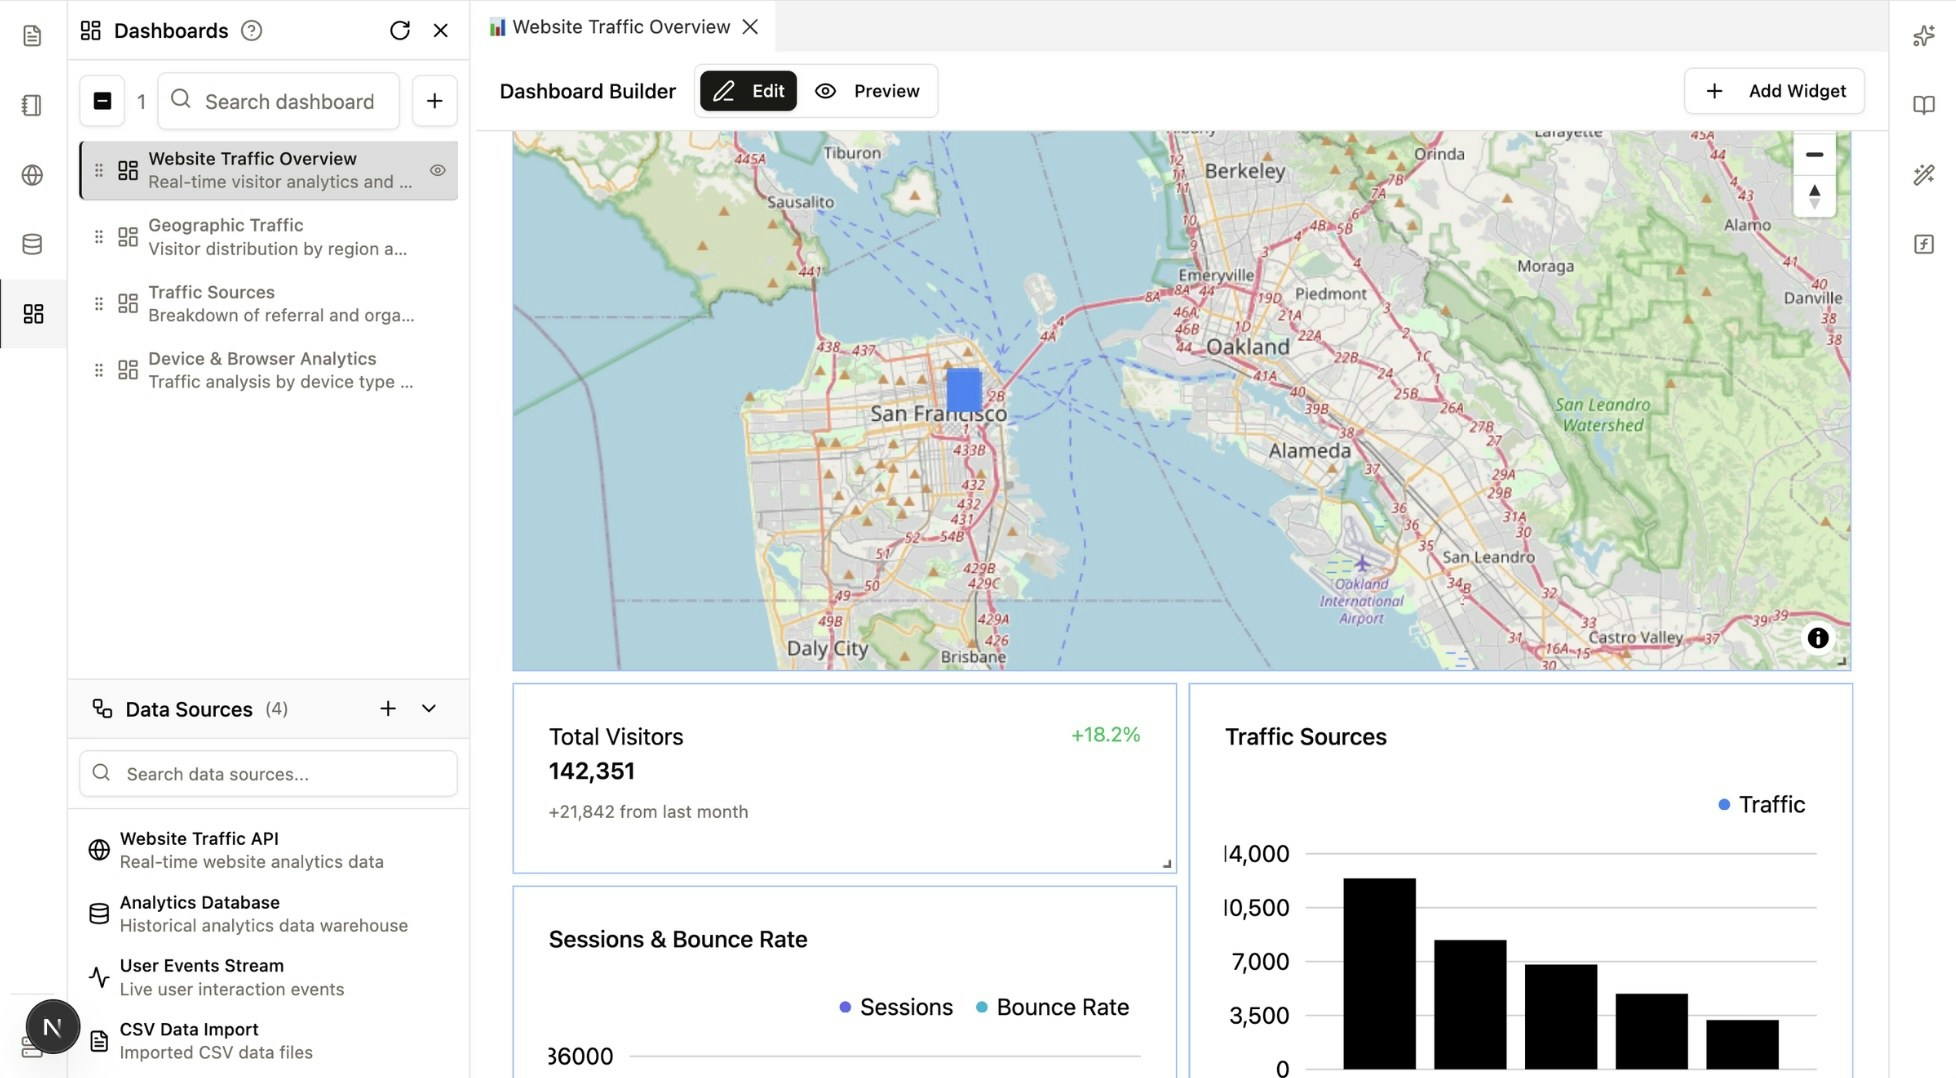
Why NikaDashboard for Spatial Dashboards?
NikaDashboard offers unique advantages over traditional BI tools like Tableau or Databricks SQL/BI, and GIS-specific platforms like ArcGIS Dashboards:- Custom Widget Generation: Generate custom widgets that work exactly as needed, providing flexibility beyond standard chart libraries.
- Direct NikaMap Integration: Native integration with the powerful NikaMap engine enables advanced geospatial visualizations that are deeply synchronized with your dashboard data.
- Complete Theme Control: Create your own styles and themes. Every element—from buttons to color palettes—can be customized to align perfectly with your brand kit.
- Layout Versatility: Switch between a classic side-by-side canvas layout (classic style) or an overlay mode where widgets sit on top of a single, interactive map.
Key Features
Visual Dashboard Builder
- Drag-and-Drop Interface: Build dashboards visually with no coding required
- Real-time Preview: Switch between Edit and Preview modes to see how dashboards appear to end users
- Customizable Layouts: Flexible grid system for arranging widgets and components on blank canvas or over a map
- Mobile Support: Responsive design for viewing dashboards on mobile or tablet devices
Real-time Data Integration
- Live Data Feeds: Connect to real-time data sources for up-to-the-minute analytics
- Multiple Data Sources: Support for databases and CSV/GeoJSON imports
- Auto-refresh: Configurable refresh intervals for different data sources
- Data Validation: Built-in data quality checks and error handling
Collaboration & Sharing
- Team Dashboards: Create and share dashboards across your organization
- Permission Controls: Granular access control for different user roles
- Version History: Track changes and maintain dashboard edit history
Dashboard Components
Data Sources
- Enternal API: External API integration as data influx
- Enterprise Database: Historical data warehouse connectivity
- CSV Data Import: Upload and process CSV data files
- IoT Data Stream: Real-time IoT device data integration via MQTT
Widget Types
- Data Filter: Filter data by various column and expressions so that map and table are updated
- AOI Upload: Upload GeoJSON or Shapefile to define the area of interest for the dashboard
- Bar Chart: Comparative analysis and category breakdowns with customizable styling
- Line Chart: Time series visualization for temporal data analysis and trends
- Graph Chart: Network and relationship visualization for complex data structures
- Map: Interactive geographic visualization with custom styling and overlays
- Icon Board: Visual display with icons, metrics, and status indicators
- Text Board: Rich text display for annotations, descriptions, and contextual information
Common Use Cases
- Traffic Monitoring: Real-time visitor analytics and traffic source analysis
- Geographic Insights: Visitor distribution by region and location
- Location Analytics: Geographic distribution of users, customers, or assets
- Movement Analysis: Traffic flow patterns and movement visualization
- Regional Performance: Location-based performance metrics and comparisons
- Spatial Correlation: Geographic relationships and spatial analysis
Integration
NikaDashboard integrates seamlessly with other Nika products:- NikaWorkspace: Use workspace data as source directly in dashboards
- NikaMap: Embed interactive maps in dashboard widgets
- NikaFunction: Use serverless functions for custom data processing
- NikaDBMS: Use database data directly as source in dashboards
Get Expert Help
Talk to a Geospatial Expert
Need help with your geospatial projects? Our team of experts is here to assist you with implementation, best practices, and technical support.
Other ways to get help:
- Guides: Use the /guides tab for detailed tutorials
- Community: Ask questions in our community forum
- Support: Send us a support request