Map Visualization Tutorial
This tutorial will guide you through creating a complete map visualization using Nika’s powerful mapping tools. You’ll learn how to create maps, add different types of data layers, and style them effectively to create compelling visualizations.What You’ll Learn
By the end of this tutorial, you’ll be able to:- Create a new map from scratch
- Add vector, raster, and image data layers
- Style different layer types for optimal visualization
- Organize and manage your map layers
- Export your final visualization
Prerequisites
Before starting, make sure you have:- Access to NikaWorkspace
- Sample data files ready (we’ll provide examples)
- A modern web browser
Step 1: Create Your First Map
Access NikaMap
- Navigate to NikaMap: In NikaWorkspace, click on the Globe icon in the left sidebar
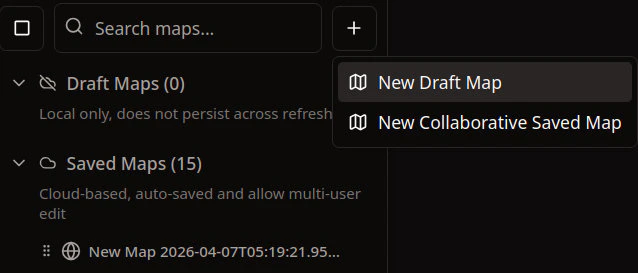
- View Map List: You’ll see a list of your existing maps on the left panel
- Create New: Click the ”+” button and then the “New Map” button to create a new one
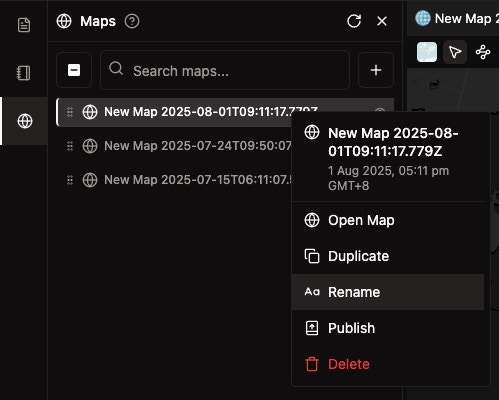
Name Your Map
- Right-click on your new map to open the rename dialog
- Enter a descriptive name like “My Visualization Project”
- Click “Save” to finalize
Step 2: Prepare Your Sample Data
For this tutorial, you’ll need three types of sample data:Vector Data (Download Sample File)
- GeoJSON file: Contains point, line, or polygon features
- Shapefile: Traditional GIS vector format
- CSV with coordinates: Tabular data with latitude/longitude columns
Raster Data (Download Sample File)
- GeoTIFF: High-quality raster imagery or elevation data
- COG: Cloud optimized geotiff raster images with the same file extension as .tiff or .tif
Image Data (Download Sample File)
- JPEG: High-resolution images for overlay
Step 3: Add Vector Layers
Upload Vector Data
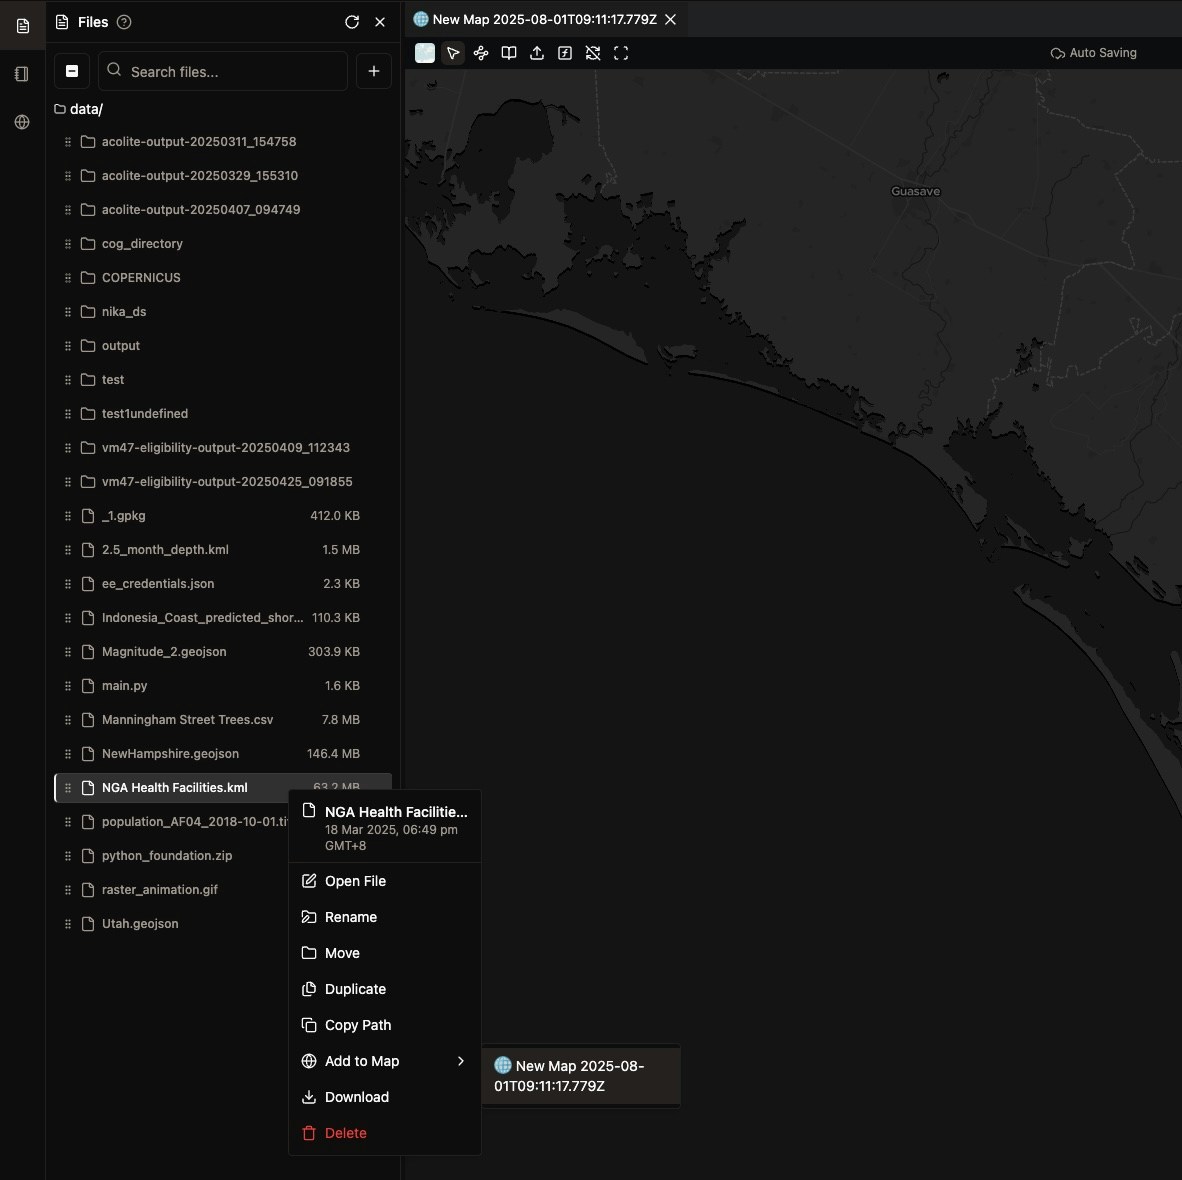
- Open Files Panel: Click “Files” in the left sidebar
- Select your vector file (GeoJSON, Shapefile, or CSV)
- Right-click and select “Add to Map” with your map selected
- Wait for processing - larger files may take a moment
Verify Layer Addition
- Check the layers panel on the left side
- Your vector layer should appear in the list
- Layer will be visible on the map automatically
Step 4: Style Your Vector Layers
Access Vector Styling
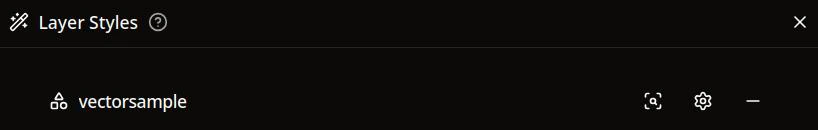
- Right-click on your vector layer in the layers panel
- Select “Layer Styles” from the context menu
- Styling panel opens with customization options
Customize Vector Appearance
For Point Layers:
- Icon Color: Set point symbol color using the color picker
- Opacity: Adjust transparency (0-100%)
For Line Layers:
- Line Color: Choose line color from the color picker
- Line Width: Set thickness using the slider (in pixels)
- Opacity: Control transparency
For Polygon Layers:
- Fill Color: Set interior color of polygons
- Opacity: Adjust fill transparency
- Line Color/Width: Customize polygon borders
Layer Organization
- Reorder layers by dragging them in the layers panel
- Bottom layers appear on top of the map
- Toggle visibility using the eye icon
Step 5: Add and Style Raster Layers
Upload Raster Data
- Select your raster file (GeoTIFF, JPEG with georeference)
- Add to map drag the .tiff file from your desktop into middle section of the opened NikaMap to upload it directly
- Wait for processing - raster files may take longer
Access Raster Styling
- Right-click on your raster layer
- Select “Layer Styles” to open the styling panel
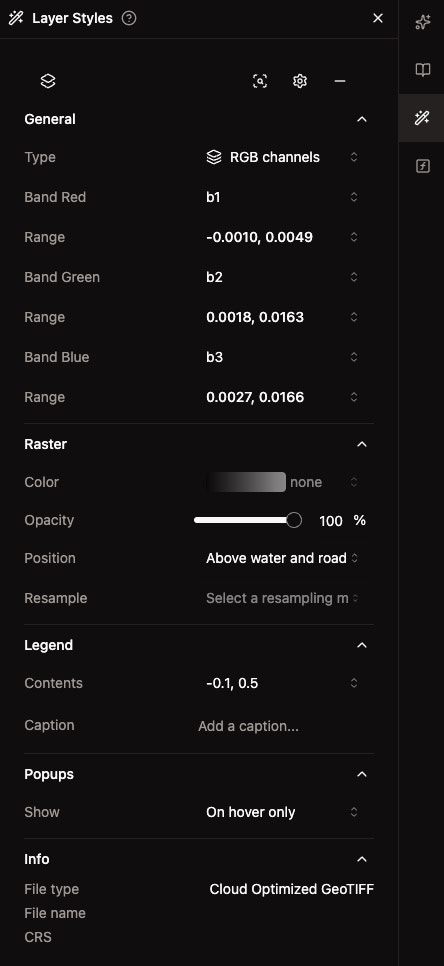
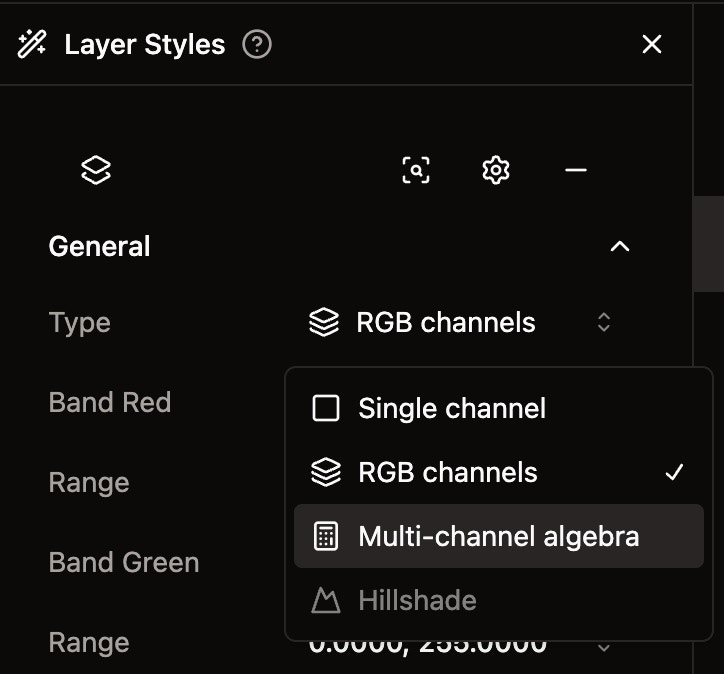
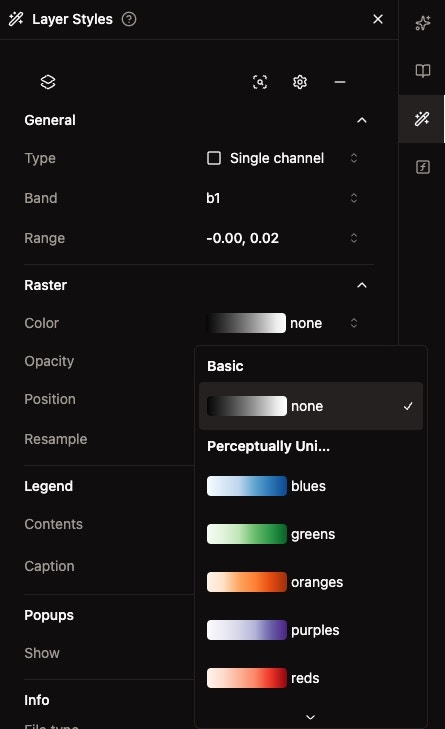
Choose Visualization Type
Single Channel Mode:
- Select one band (b1, b2, b3, etc.)
- Set data range using min/max sliders
- Apply color map (grayscale, blues, greens, etc.)
RGB Channels Mode:
- Assign bands to Red, Green, and Blue channels
- Set individual ranges for each color channel
- Create natural or false color composites
Adjust Data Range
- View histogram showing data distribution
- Drag sliders to set optimal min/max values
- See real-time updates on the map
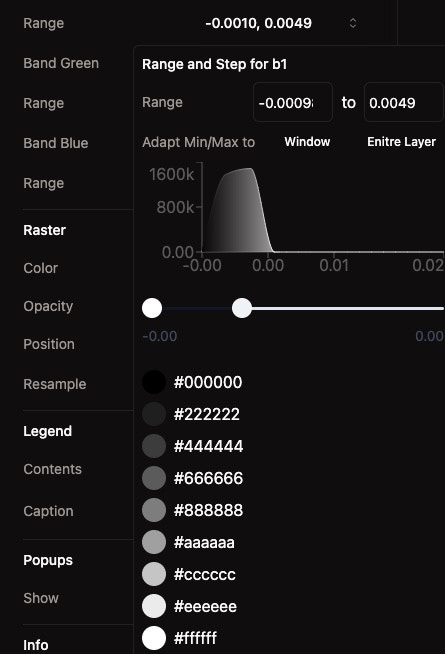
Select Color Maps
Choose from various color schemes:- Grayscale: For general data visualization
- Sequential colors: For continuous data (elevation, temperature)
- Specialized: Rainbow, Viridis, Plasma for complex data
Step 6: Add Image Overlays
Upload Image Data
- Select your image file (JPEG, PNG)
- Add to map using drag-and-drop or right-click
- Position appropriately in the layer stack
Image Layer Management
- Adjust opacity to blend with underlying layers
- Reorder layers to control stacking
- Toggle visibility as needed
Step 7: Finalize Your Visualization
Layer Organization
- Arrange layers logically: Background to foreground
- Set appropriate opacity for each layer
- Ensure proper stacking order
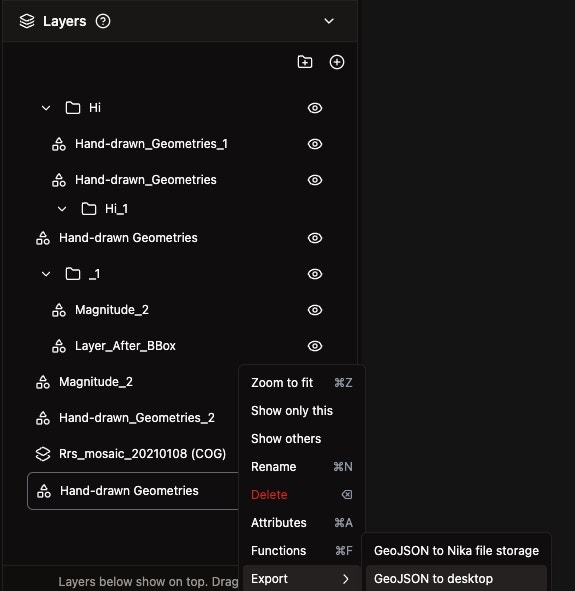
Export Your Map
- Right-click on individual vector layers to export as GeoJSON
- Right-click on layer groups to export as GeoPackage
- Choose destination: Desktop or NikaWorkspace storage
Share Your Visualization
- Publish your map for public sharing
- Collaborate with team members
- Export high-resolution images for presentations
Best Practices for Map Visualization
Data Preparation
- Use appropriate file formats for your data type
- Ensure proper coordinate systems (will auto-convert to EPSG:3857)
- Keep file sizes reasonable for optimal performance
Visual Design
- Choose complementary colors for different layer types
- Use opacity effectively to show multiple layers
- Consider colorblind-friendly color schemes when possible
Performance Optimization
- Limit the number of simultaneous layers
- Simplify complex geometries when possible
- Use appropriate zoom levels for detailed data
Layer Management
- Use descriptive names for all layers
- Group related layers together
- Remove unused layers to keep maps clean
Troubleshooting Common Issues
Layer Not Appearing
- Check visibility: Ensure the eye icon is enabled
- Zoom to layer: Double-click layer name to zoom to extent
- Verify coordinate system: Data should have proper spatial reference
Performance Issues
- Reduce file sizes: Simplify large datasets
- Limit active layers: Hide unnecessary layers
- Refresh browser: Clear cache if needed
Styling Problems
- Reset styling: Use reset button in styling panel
- Check data ranges: Ensure min/max values are appropriate
- Verify layer order: Ensure proper stacking
Next Steps
Now that you’ve mastered basic map visualization:- Explore Advanced Styling: Learn about attribute-based styling and custom color schemes
- Create Interactive Maps: Add popups and interactive features
- Collaborative Mapping: Work with team members on shared projects
- Publish and Share: Make your visualizations public