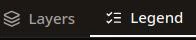
Accessing the Legend
The layer panel has two tabs at the top: Layers and Legend.- Layers tab: The full layer list where you manage, reorder, and style layers
- Legend tab: A focused view showing only the legend-relevant information for each layer
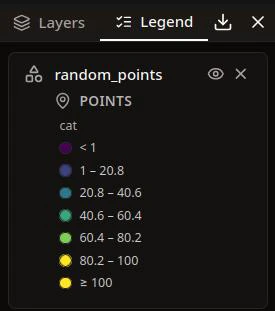
Legend Entry Structure
Each layer included in the legend displays:- Layer icon — indicates the layer type (vector, raster, etc.)
- Layer name — the name as shown in the layer list
- Visibility toggle — an eye icon to show or hide the layer on the map directly from the legend
- Remove from legend button — an X icon to exclude the layer from the legend without removing it from the map
- Caption (if set) — descriptive text displayed below the layer name
- Symbology — the visual representation of how the layer is styled (color swatches, gradients, class breaks, etc.)
Show and Hide Layers in the Legend
By default, all layers are included in the legend. You can control which layers appear.Remove a Layer from the Legend
You have two options:- In the Legend tab: Click the X button on any legend entry to remove it
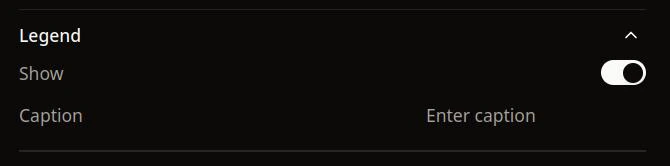
- In the Layer Styles panel: Toggle the Show switch off in the Legend section
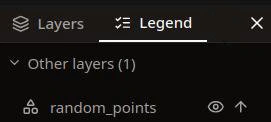
Restore a Layer to the Legend
Layers removed from the legend appear in a collapsible “Other layers” section at the bottom of the Legend tab.- Click “Other layers (N)” to expand the section
- Click the arrow-up icon next to any layer to add it back to the legend
Toggle Layer Visibility
The eye icon on each legend entry controls whether the layer is visible on the map. This is the same as toggling visibility in the Layers tab — hidden layers remain in the legend but are not rendered on the map.Add a Caption
Captions add descriptive text below the layer name in the legend entry.- Select the layer to open its styling panel
- Expand the Legend section
- Type your caption in the Caption field
- The caption is saved automatically (with a short debounce delay)
Legend Order
The legend displays layers in the same order as the layer list. To change the legend order:- Switch to the Layers tab
- Drag and drop layers to reorder them
- Switch back to the Legend tab — the order is reflected immediately
How Each Layer Type Displays in the Legend
The legend automatically generates symbology based on each layer’s current styling configuration.Vector Layers
Vector layer legends are organized by geometry type when a layer contains mixed geometries. Each geometry section shows its own symbology.Polygons
- Solid color: A filled square swatch showing the fill color, with an outline if stroke is enabled
- Gradient (continuous): A smooth color ramp bar with min/max labels, labeled by the property name
- Gradient (discrete/classify): A list of colored swatches with value range labels (e.g., “0.5 – 1.2”)
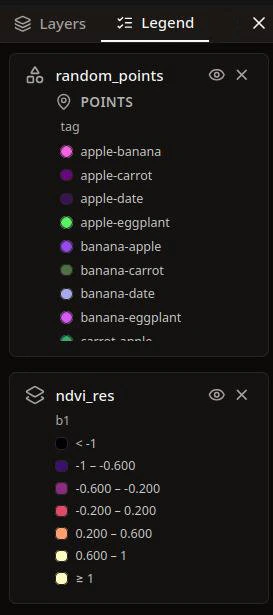
- Unique values: A list of colored swatches, one per unique value with its label
Lines
- Solid color: A horizontal line swatch in the line color
- Gradient / Unique values: Same class-break or value list format as polygons, but with line swatches
Points
- Solid color: A filled circle swatch in the icon/point color
- Gradient / Unique values: Same format as polygons, but with circle swatches
Raster Layers
Raster legend display depends on the visualization type and color mode.Single Channel with Named Colormap
A color ramp bar showing the gradient from the selected colormap (e.g., Viridis, Blues), with min and max rescale values at either end. The band name or algebra expression is shown as a label.Single Channel with Classify
A discrete class list showing colored swatches for each class break with value range labels (e.g., ”< 0.2”, “0.2 – 0.4”, ”>= 0.8”).Single Channel with Unique Values
A value list showing one colored swatch per unique integer value, with custom labels if set.RGB Channels (Multi-Channel)
A three-part red/green/blue swatch labeled “RGB Composite”, with the band assignments listed below (e.g., “R: b4 · G: b3 · B: b2”).Raster Algebra
Displays the same as Single Channel — the algebra expression name (e.g., NDVI) is shown as the label, with the colormap gradient and rescale range.No Colormap Set
Falls back to a grayscale gradient bar (black to white) with the rescale range.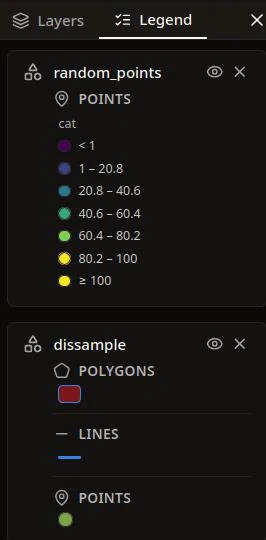
Best Practices
- Include only meaningful layers — remove background or reference layers from the legend to keep it focused on the data that matters
- Add captions to provide context — a short description like “Population density per km²” makes the legend self-explanatory
- Use consistent layer naming — legend entries show the layer name, so clear names make the legend readable without captions
- Order layers logically — since legend order follows layer order, arrange layers so the legend reads naturally from top to bottom